
Infographics
Australia vs UK: GDP per capita Comparison 1990 vs 2025
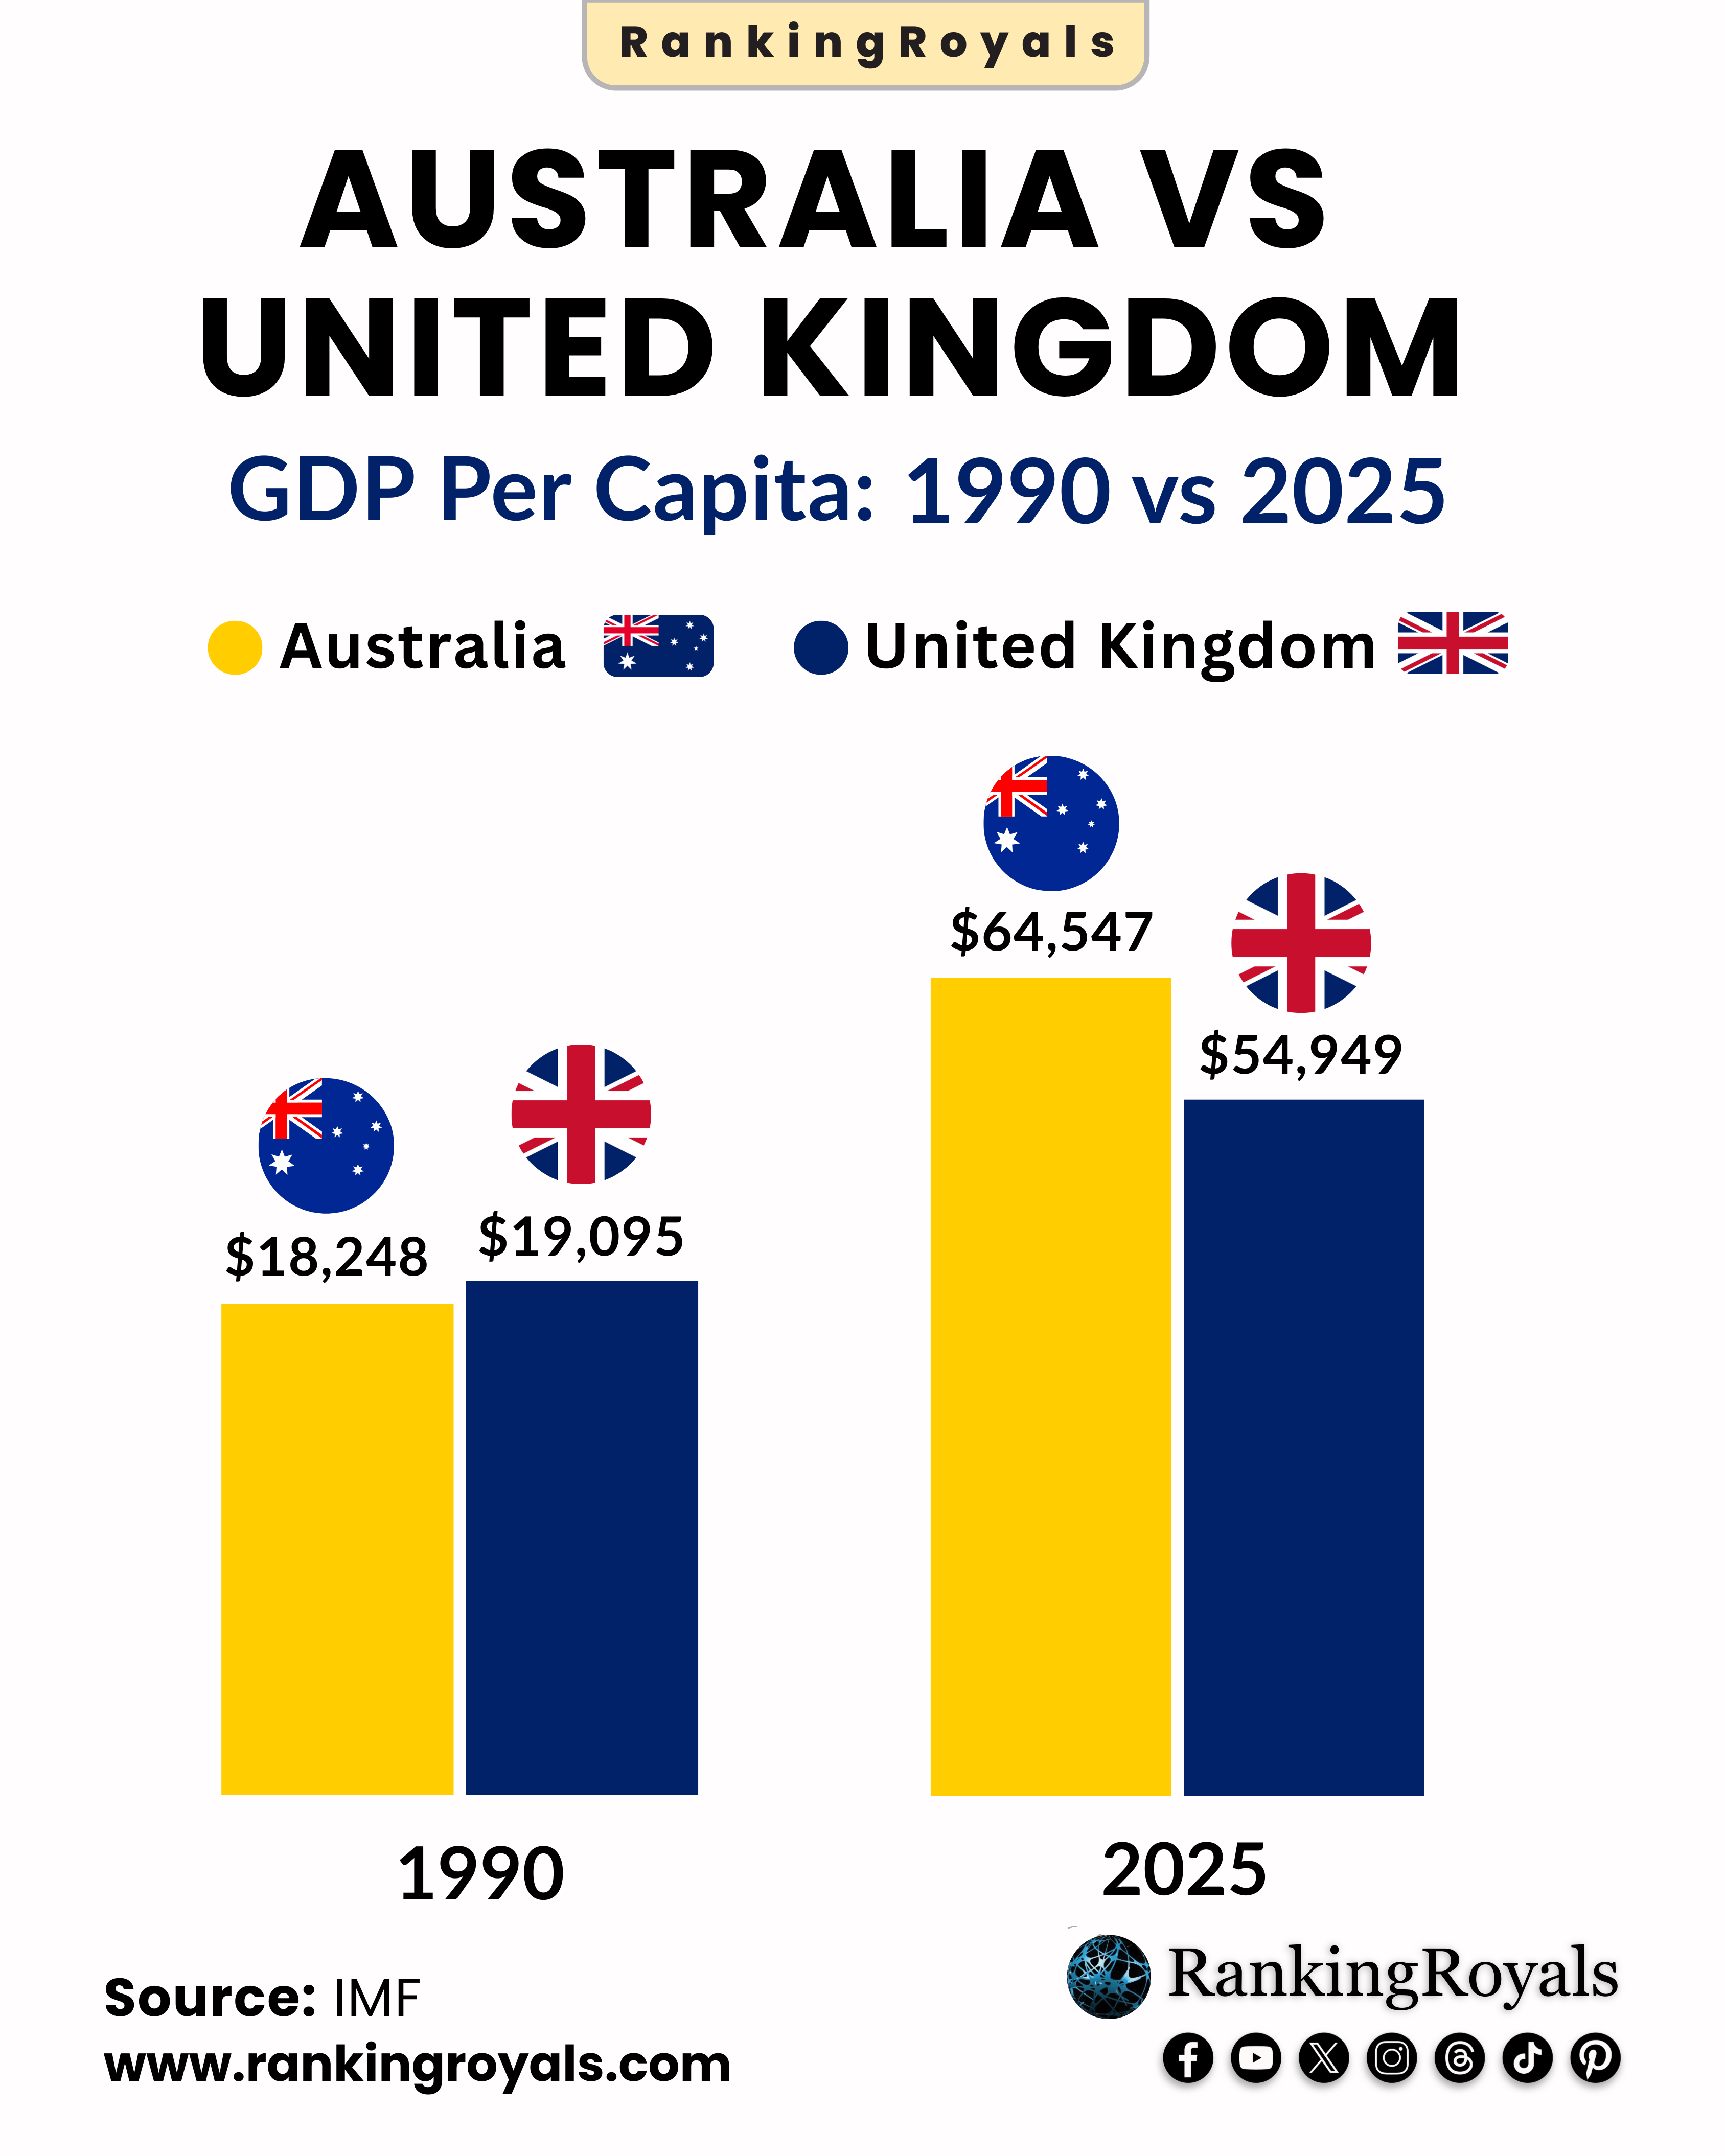
Australia handled the 2008 Global Financial Crisis more successfully than the UK, maintaining positive economic growth while the UK experienced a contraction. This resilience allowed Australia to surpass the United Kingdom in GDP per capita after 2008 and the gap continued to increase. In recent years, Australia has consistently reported lower unemployment rates and higher GDP growth than the UK, resulting in higher average incomes.
Mining is a major industry in Australia, contributing between 12% and nearly 14% of the country’s GDP in recent years. Australia has large iron ore, coal, natural gas, and other minerals reserves. This leads to high export revenues and creates many high-paying jobs, making mining the largest export sector in Australia and an important part of the nation’s wealth. Australia’s resource wealth, economic strength, and favorable population trends have helped it surpass the UK in GDP per capita.
Australia has a much smaller population (about 26 million vs. the UK’s 68 million) and a much lower population density. This allows for higher per capita resource allocation and less strain on infrastructure and public services.
Australia’s tax system relies more on income, profits, and capital gains, while the UK relies more on taxes from goods and services. This difference in tax composition may influence disposable incomes and investment incentives. Australia has kept public debt and inflation relatively low which supports economic stability and consumer confidence.
