
Agriculture
Highest Milk Consumption Per Capita (Top 185 Countries)
Milk is an essential food that has been consumed by humans for thousands of years. It is a major source of essential nutrients such as protein, calcium, and vitamins which are necessary for maintaining good health. Depending on factors such as cultural traditions, availability, and lifestyle choices, milk consumption varies widely across countries and regions. Analyzing the patterns of milk consumption can reveal information on diet and health outcomes for populations around the world. We are going to look at each country’s consumption of milk per capita, analyzing variations and trends over the periods.
History of Milk Drinking
After the domestication of animals during the Neolithic Revolution or the development of agriculture, humans first learned to drink milk from other mammals on a regular basis. Between 9000–7000 BC in Mesopotamia and 3500–3000 BC in the Americas, the development occurred separately in several parts of the world. Sheep, goats, and cattle were the first dairy animals to be domesticated around 9,000 years ago. For food safety reasons, milk from animals was converted to yogurt, cheese, and butter before humans began drinking it regularly. For around 6,000 to 8,000 years, humans have been drinking milk from cows, and it’s likely that the first European farmers did so.
What are some benefits of drinking milk?
Drinking milk has many benefits. Milk is a big source of calcium that helps to strengthen teeth and bones and maintain their density. We should drink milk daily to prevent various types of bone and dental health problems. Milk also provides many vital nutrients such as vitamin A, vitamin D (in products fortified with vitamin D), riboflavin, phosphorus, vitamin B12, zinc, potassium, choline, and magnesium. There has also been evidence that women’s daily consumption of milk reduces knee osteoarthritis or joint inflammation. Milk contains a variety of components that are capable of contributing to weight loss as well as preventing weight gain.
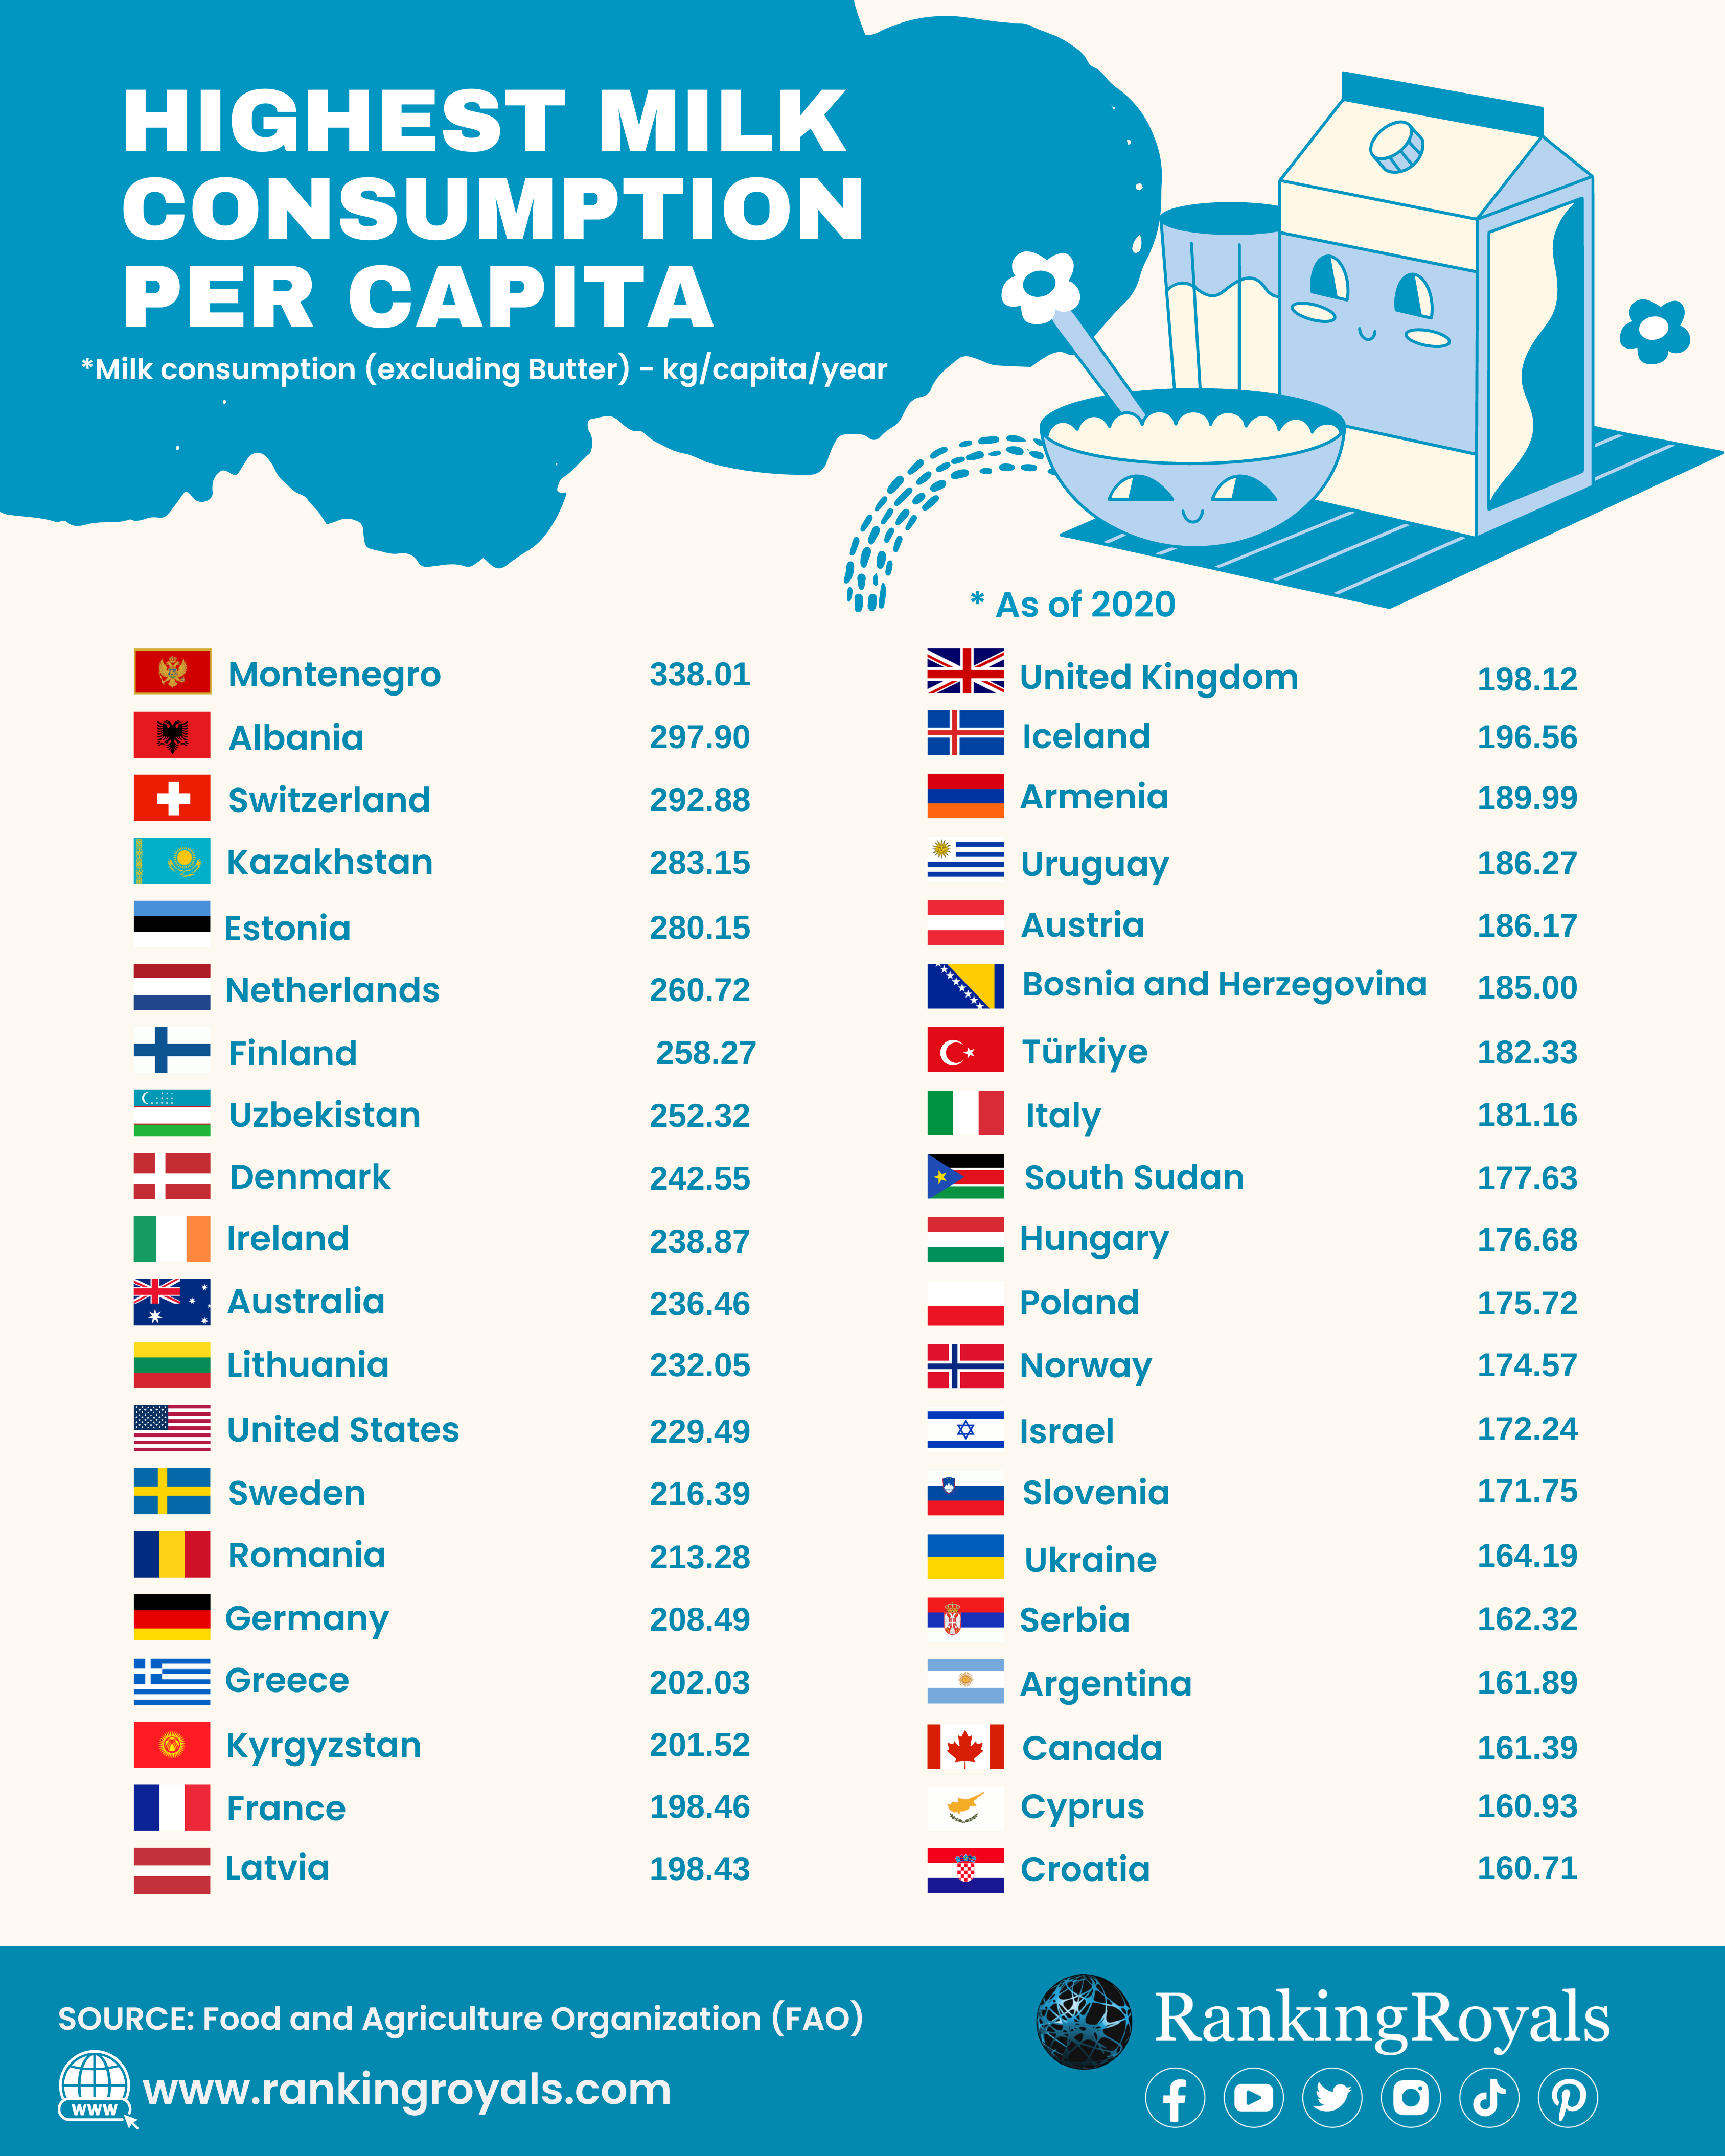
The following are the top 5 countries with the highest milk consumption per capita (as of 2020):
1. Montenegro
Montenegro is ranked first in terms of milk consumption per capita, with an average of 338.01 kg/capita. In 2021, the production of milk for Montenegro was 173,409 tonnes. The price of 1 liter of milk in Montenegro is $1.27.
The dairy sector in Montenegro consists of small-scale farming. Based on milk production of approximately 26270 farms with an average herd size of 2.9 cows and milk yield of 2700 kg per cow.
What are some popular dairy products in Montenegro?
There are a large variety of dairy products in Montenegro. White brined cheese, leafy cheeses, Njeguši cheese, and fermented dairy products with a very special flavor called “skorup” are some of the main ones.
2. Albania
Albania is ranked second in terms of milk consumption per capita, with an average of 297.90 kg/capita. In 2021, the production of milk for Albania was 1,013,033 tonnes. The price of 1 liter of milk in Albania is $1.52.
Albania’s dairy industry is distinguished by its sizable number of small milk producers. Cow milk is produced by about 210,000 agricultural properties, the great majority of which have less than five cows.
What are some popular dairy products in Albania? In Albania, dairy products are a popular product which includes yogurt, cheese, milk, and butter.
3. Switzerland
Switzerland is ranked third in terms of milk consumption per capita, with an average of 292.88 kg/capita. In 2021, the production of milk in Switzerland was 3,840,200 tonnes. The price of 1 liter of milk in Switzerland is $1.83.
The most important sector of the Swiss agriculture industry is milk production. In Switzerland, there are nearly 20,000 dairy farmers who maintain a combined total of about 560,000 cows and generate approximately 4 billion kg of milk annually. The Swiss dairy farming sector, particularly in mountain locations, can serve as a model for sustainable dairy farming.
What are some popular milk-based drinks in Switzerland? Hot chocolate is one of Switzerland’s favorite drinks made from milk. The Swiss have some of the best chocolates and milks in the world, so it’s no wonder that hot chocolate is their favorite drink. Another popular milk-based drink is Rivella, a soda beverage manufactured from milk whey or milk serums produced in the cheese-making process. It is available in different tastes, including delicious fruity and herbal flavors.
What are some popular Swiss dairy products? In Switzerland, there is a tradition of dairy farming and cheese production. Milk is frequently used as an essential ingredient in Swiss foods; butter and cream are traditional ingredients in Swiss cuisine. Emmental, Gruyère, Vacherin, and Appenzeller cheeses are popular Swiss products. In Switzerland, almost 500 types of cheeses are produced from dairy farms and mountain pastures.
4. Kazakhstan
Kazakhstan is ranked fourth in terms of milk consumption per capita, with an average of 283.15 kg/capita. In 2021, the production of milk for Kazakhstan was 6,247,200 tonnes. The price of 1 liter of milk in Kazakhstan is $1.07.
What are some other dairy products consumed in Kazakhstan? The popular drinks in Kazakhstan are fermented milk products. Shubat and kumys (kumis) are made from camel and mare’s milk, while katyk and ayran are derived from cow’s milk. Shyrchay is black tea with milk, salt, butter, flour, and fried tail fat.
The Kazakhstan dairy industry is organized into three categories: home dairy farmers who use common pastures, peasant/small and medium-scale dairy farmers who own land, and agricultural companies. In Kazakhstan, the dairy sector provides jobs for around two million families. 80% of the country’s milk is produced by small-scale farmers, whose herds are composed of only five cows.
5. Estonia
Estonia is ranked fifth in terms of milk consumption per capita, with an average of 280.15 kg/capita. In 2021, the production of milk for Estonia was 839,400 tonnes. The price of 1 liter of milk in Estonia is $1.03. Drinking milk with a 2.5% fat content is the most common type of drinking milk in Estonia.
What are some popular dairy products in Estonia? Cheese, raw milk, curd, yogurt, fermented milk products, and butter are some of Estonia’s most popular dairy products.
Due to their strong quality control and food safety regulations, Estonian dairy products are popular in both domestic and international markets.
What are the different types of milk available?
There is a wide variety of milk on the market. The most common types of milk are whole milk (3.25% milk fat), reduced-fat milk (2%), low-fat milk (1%), and fat-free milk, also known as skim milk. Other types of milk include organic, flavored, powder, raw untreated, condensed, and evaporated. There are varying differences in the calorific and nutritional content of each type of milk. Before choosing a milk type, it is necessary to verify the list of ingredients and any additional nutrient information.
What are some other popular dairy products?
Dairy products are widely consumed around the world. Some of the most popular dairy products include Malai from India, Greek Yogurt from Greece, Kiselo mlyako from Bulgaria, Twaróg from Poland, and Clotted Cream from Cornwall. Some other popular dairy products worldwide include Kefir from Russia, Crème fraîche from Normandy, France, and Kaymak from Turkey.
What role does technology have in improving the dairy industry?
Technology has a significant role in improving the dairy sector. Through the use of robotics and automation, it has contributed to increasing production lines. Moreover, it helped to maintain the freshness of milk and improve supply chain efficiency. Technology uses have also increased the range of dairy products in the market. Smart Dairy Farming is creating novel solutions and systems by integrating sensors, the Internet of Things (IoT), broadband technology, and data analytics. These innovations are not only aimed at improving milk yield but also increasing the efficiency of dairy processes.
Here is a List of Milk Consumption by Country, According to the FAO:
| Rank | Country | Per Capita (Kg) |
|---|---|---|
| 1 | Montenegro | 338.01 |
| 2 | Albania | 297.90 |
| 3 | Switzerland | 292.88 |
| 4 | Kazakhstan | 283.15 |
| 5 | Estonia | 280.15 |
| 6 | Netherlands | 260.72 |
| 7 | Finland | 258.27 |
| 8 | Uzbekistan | 252.32 |
| 9 | Denmark | 242.55 |
| 10 | Ireland | 238.87 |
| 11 | Australia | 236.46 |
| 12 | Lithuania | 232.05 |
| 13 | United States | 229.49 |
| 14 | Sweden | 216.39 |
| 15 | Romania | 213.28 |
| 16 | Germany | 208.49 |
| 17 | Greece | 202.03 |
| 18 | Kyrgyzstan | 201.52 |
| 19 | France | 198.46 |
| 20 | Latvia | 198.43 |
| 21 | United Kingdom | 198.12 |
| 22 | Iceland | 196.56 |
| 23 | Armenia | 189.99 |
| 24 | Uruguay | 186.27 |
| 25 | Austria | 186.17 |
| 26 | Bosnia and Herzegovina | 185.00 |
| 27 | Türkiye | 182.33 |
| 28 | Italy | 181.16 |
| 29 | South Sudan | 177.63 |
| 30 | Hungary | 176.68 |
| 31 | Poland | 175.72 |
| 32 | Norway | 174.57 |
| 33 | Israel | 172.24 |
| 34 | Slovenia | 171.75 |
| 35 | Ukraine | 164.19 |
| 36 | Serbia | 162.32 |
| 37 | Argentina | 161.89 |
| 38 | Canada | 161.39 |
| 39 | Cyprus | 160.93 |
| 40 | Croatia | 160.71 |
| 41 | Costa Rica | 156.99 |
| 42 | Spain | 156.57 |
| 43 | Mongolia | 154.71 |
| 44 | Czechia | 154.53 |
| 45 | Azerbaijan | 153.80 |
| 46 | Russia | 152.36 |
| 47 | Brazil | 151.05 |
| 48 | Georgia | 150.04 |
| 49 | Slovakia | 144.74 |
| 50 | Portugal | 140.37 |
| 51 | Belgium | 133.06 |
| 52 | North Macedonia | 129.31 |
| 53 | Bulgaria | 127.62 |
| 54 | Nicaragua | 126.97 |
| 55 | Belarus | 122.97 |
| 56 | Pakistan | 121.19 |
| 57 | Colombia | 111.33 |
| 58 | Botswana | 109.78 |
| 59 | Malta | 108.59 |
| 60 | New Zealand | 102.25 |
| 61 | Turkmenistan | 100.36 |
| 62 | El Salvador | 99.17 |
| 63 | Venezuela | 97.70 |
| 64 | Syria | 95.64 |
| 65 | Luxembourg | 94.50 |
| 66 | Ecuador | 94.21 |
| 67 | Tajikistan | 93.28 |
| 68 | Oman | 92.42 |
| 69 | Mexico | 91.61 |
| 70 | Sudan | 90.65 |
| 71 | Tunisia | 90.35 |
| 72 | Chile | 89.46 |
| 73 | Dominican Republic | 85.61 |
| 74 | Cuba | 82.48 |
| 75 | Guyana | 80.39 |
| 76 | Kenya | 79.52 |
| 77 | Dominica | 77.93 |
| 78 | Mauritania | 74.99 |
| 79 | Republic of Moldova | 73.41 |
| 80 | Algeria | 73.32 |
| 81 | Jamaica | 69.87 |
| 82 | India | 67.04 |
| 83 | Lebanon | 61.98 |
| 84 | Paraguay | 59.73 |
| 85 | Peru | 56.36 |
| 86 | Namibia | 53.21 |
| 87 | Honduras | 51.33 |
| 88 | Lesotho | 51.09 |
| 89 | South Africa | 49.75 |
| 90 | Antigua and Barbuda | 49.71 |
| 91 | Saudi Arabia | 48.00 |
| 92 | Panama | 47.27 |
| 93 | Japan | 46.80 |
| 94 | Bahrain | 45.98 |
| 95 | Libya | 44.52 |
| 96 | Jordan | 44.14 |
| 97 | Mali | 43.62 |
| 98 | Kuwait | 43.21 |
| 99 | Eswatini | 40.45 |
| 100 | Cabo Verde | 40.19 |
| 101 | Bolivia | 39.85 |
| 102 | Niger | 39.61 |
| 103 | Bhutan | 38.34 |
| 104 | Ethiopia | 37.74 |
| 105 | Nepal | 37.34 |
| 106 | Qatar | 35.50 |
| 107 | Afghanistan | 34.66 |
| 108 | French Polynesia | 33.82 |
| 109 | Guatemala | 33.65 |
| 110 | Tanzania | 33.56 |
| 111 | Uganda | 33.46 |
| 112 | New Caledonia | 32.27 |
| 113 | Bahamas | 30.62 |
| 114 | Grenada | 30.08 |
| 115 | Belize | 29.96 |
| 116 | United Arab Emirates | 29.66 |
| 117 | Samoa | 28.86 |
| 118 | Iraq | 27.54 |
| 119 | Saint Kitts and Nevis | 27.04 |
| 120 | Egypt | 26.91 |
| 121 | Iran | 26.03 |
| 122 | Zimbabwe | 25.81 |
| 123 | China | 24.77 |
| 124 | Hong Kong SAR | 24.39 |
| 125 | Trinidad and Tobago | 24.18 |
| 126 | Saint Vincent and the Grenadines | 24.10 |
| 127 | Taiwan | 23.67 |
| 128 | Saint Lucia | 23.62 |
| 129 | Barbados | 23.45 |
| 130 | Nauru | 23.02 |
| 131 | Morocco | 22.92 |
| 132 | Gambia | 22.14 |
| 133 | Seychelles | 21.52 |
| 134 | Chad | 21.06 |
| 135 | Djibouti | 20.37 |
| 136 | Guinea-Bissau | 19.61 |
| 137 | Mauritius | 18.33 |
| 138 | Macao SAR | 17.68 |
| 139 | Myanmar | 17.16 |
| 140 | Burkina Faso | 17.07 |
| 141 | Madagascar | 16.95 |
| 142 | Bangladesh | 16.75 |
| 143 | Sri Lanka | 16.32 |
| 144 | Maldives | 16.20 |
| 145 | Thailand | 14.31 |
| 146 | Guinea | 14.22 |
| 147 | Rwanda | 14.21 |
| 148 | Central African Republic | 13.35 |
| 149 | Vanuatu | 12.08 |
| 150 | Comoros | 11.78 |
| 151 | Benin | 11.17 |
| 152 | Suriname | 11.06 |
| 153 | Senegal | 11.05 |
| 154 | Malawi | 10.65 |
| 155 | Sierra Leone | 10.12 |
| 156 | Viet Nam | 9.60 |
| 157 | South Korea | 8.86 |
| 158 | Cameroon | 8.80 |
| 159 | Yemen | 8.19 |
| 160 | Gabon | 7.86 |
| 161 | Sao Tome and Principe | 6.45 |
| 162 | Angola | 6.10 |
| 163 | Haiti | 6.04 |
| 164 | Burundi | 5.93 |
| 165 | Malaysia | 5.56 |
| 166 | Zambia | 5.36 |
| 167 | Indonesia | 4.71 |
| 168 | Fiji | 4.21 |
| 169 | Solomon Islands | 3.94 |
| 170 | Timor-Leste | 3.94 |
| 171 | Mozambique | 3.68 |
| 172 | Cambodia | 3.33 |
| 173 | Micronesia | 2.99 |
| 174 | North Korea | 2.97 |
| 175 | Laos | 2.59 |
| 176 | Kiribati | 2.36 |
| 177 | Liberia | 2.34 |
| 178 | Ghana | 2.04 |
| 179 | Togo | 1.69 |
| 180 | Côte d'Ivoire | 1.24 |
| 181 | Nigeria | 1.18 |
| 182 | Philippines | 1.08 |
| 183 | Papua New Guinea | 1.05 |
| 184 | Congo | 1.03 |
| 185 | DR Congo | 0.16 |
Read More: The 100 Universities for Global Impact


