
Infographics
Most Satisfying Car Brands vs. Most Reliable Car Brands (Detailed Analysis as of 2024)
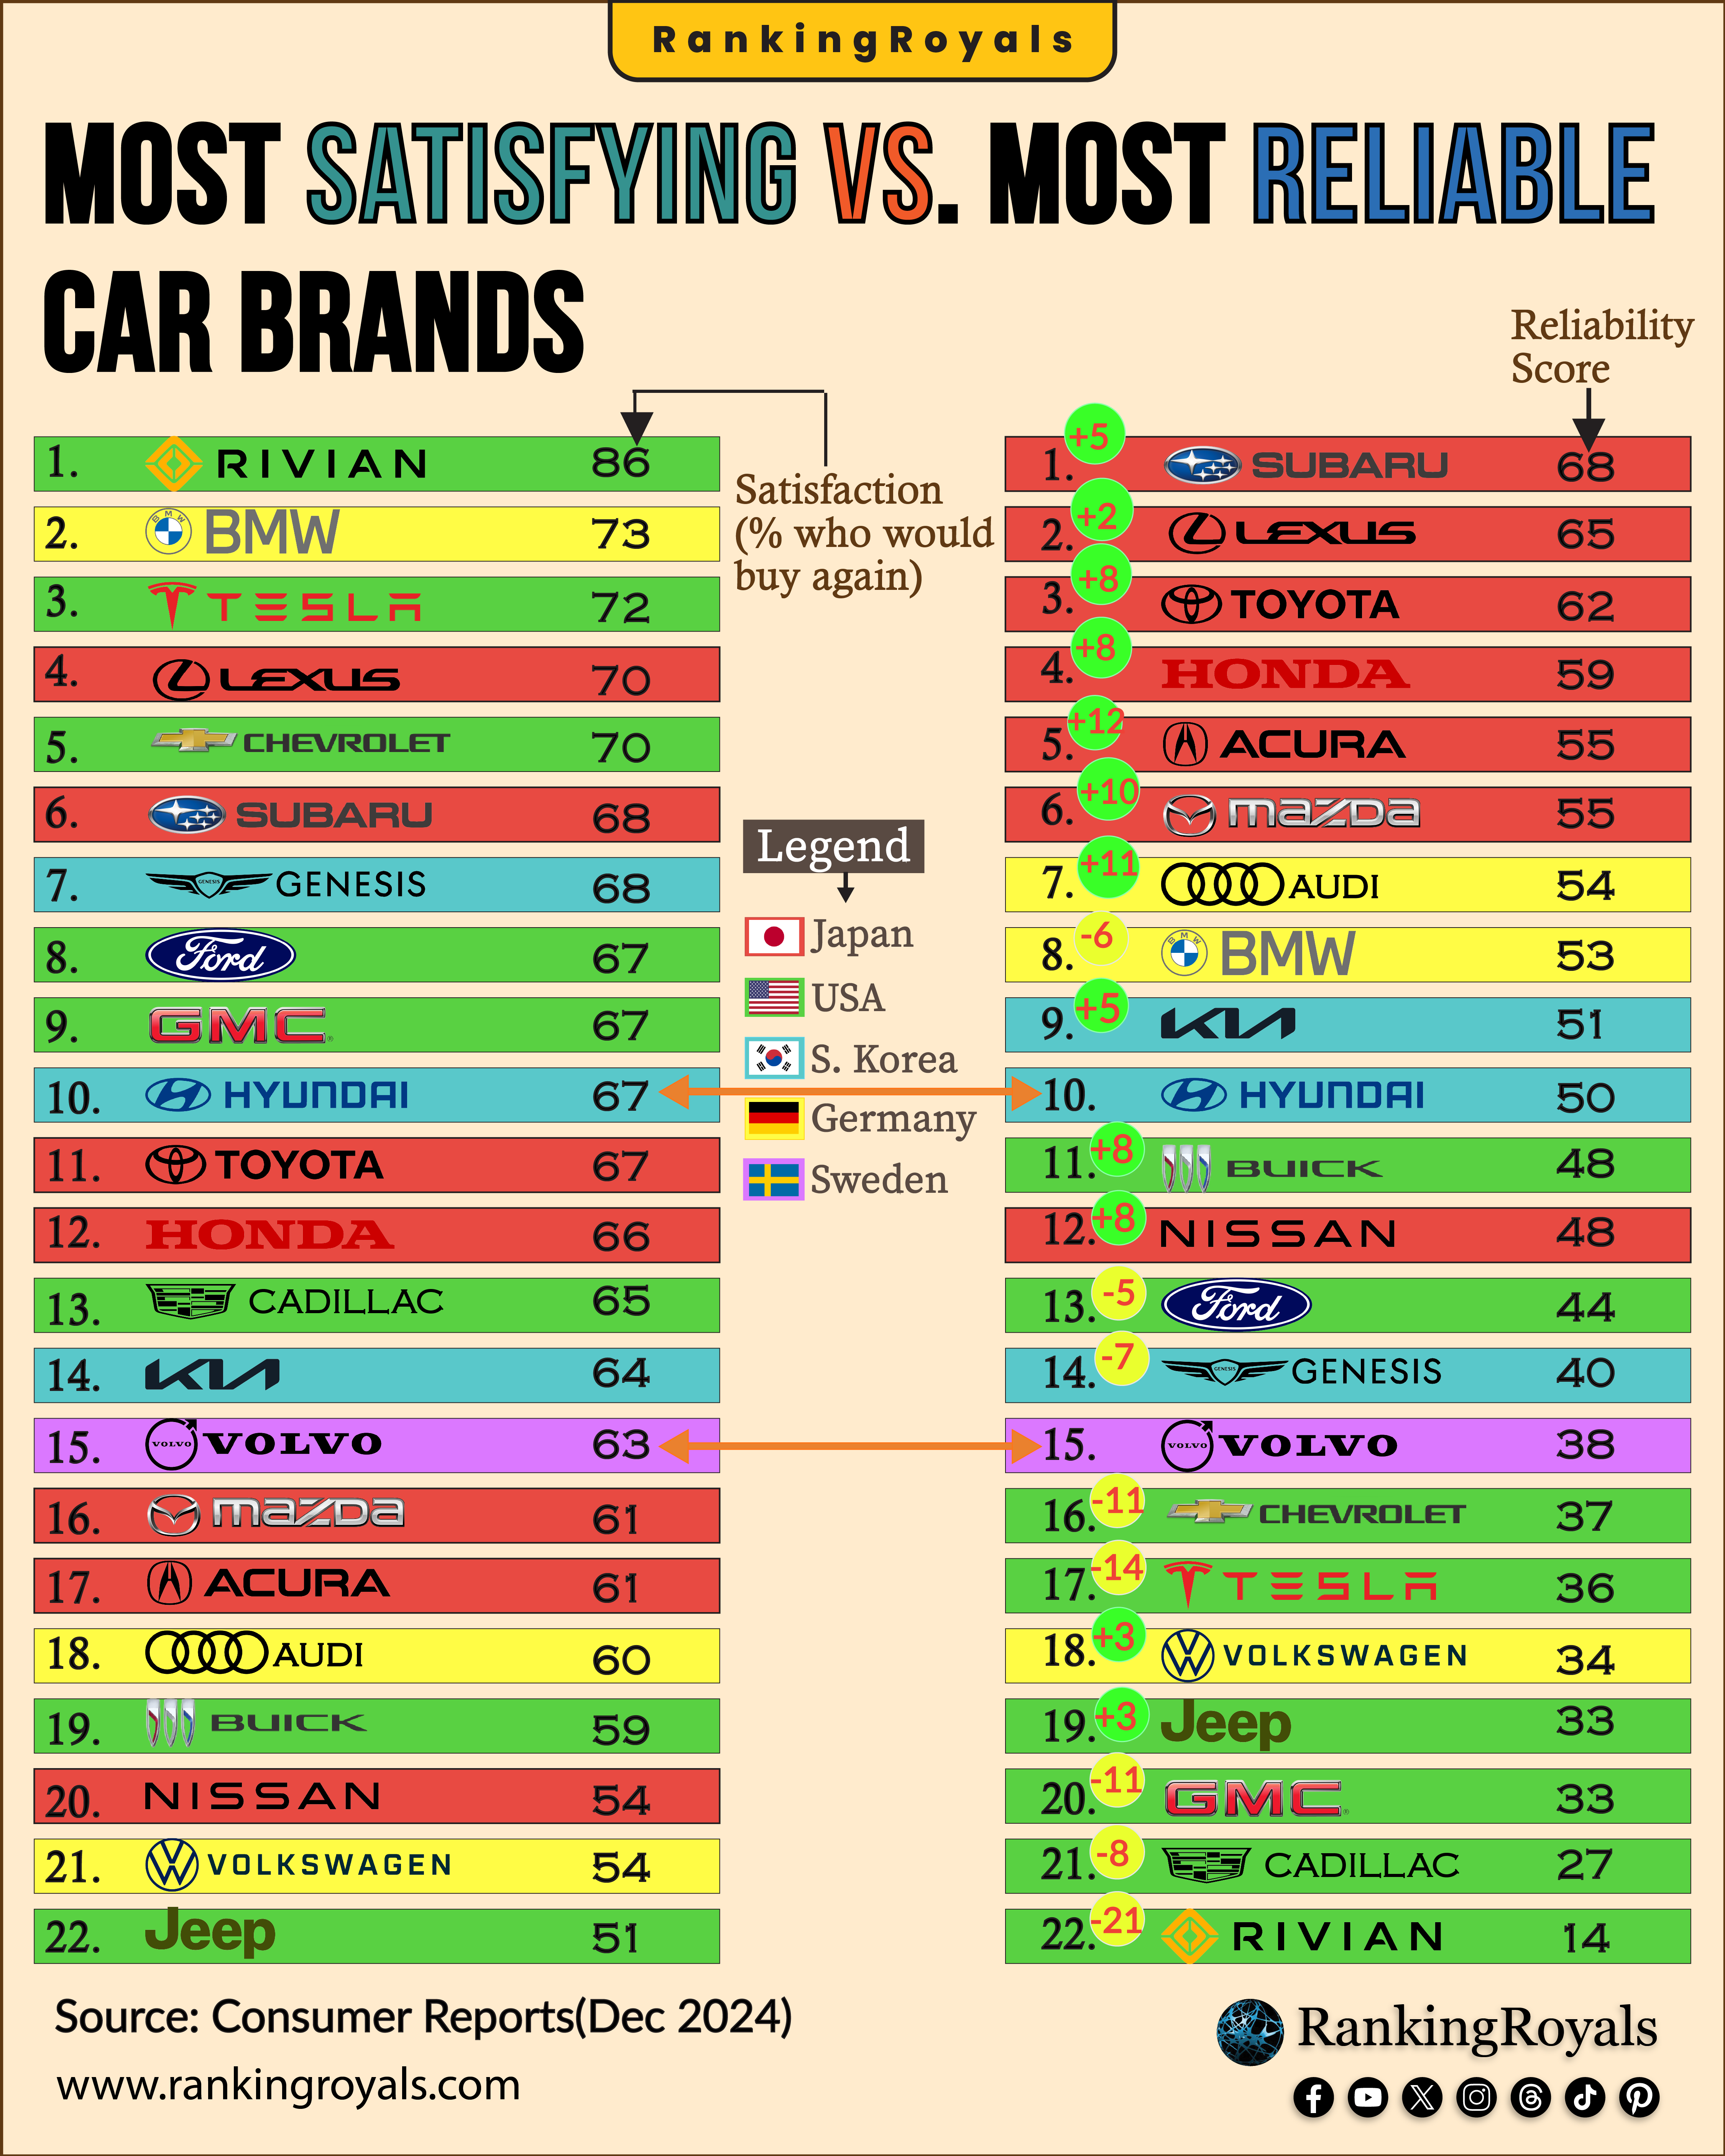
According to Consumer Reports’ comprehensive survey data, there’s a striking disconnect between how much owners love their vehicles and how dependable those vehicles are. This analysis examines all 22 major car brands evaluated in the study which provides essential information for anyone considering their next vehicle purchase.
Key Findings: The Satisfaction-Reliability Paradox
The most significant revelation from the 2024 data is that owner satisfaction doesn’t necessarily correlate with reliability. Electric vehicle manufacturers like Rivian and Tesla top the satisfaction charts but rank among the lowest for reliability, while traditional Japanese brands excel in dependability but generate more modest enthusiasm among owners.
Top Performers in Both Categories
Lexus: The Gold Standard Balance
Satisfaction: 70% (4th) | Reliability Score: 65 (2nd) | Global Sales: 851,214 units
Lexus achieves the best overall balance between satisfaction and reliability. With record global sales of 851,214 units in 2024, representing a 3.3% increase, Lexus demonstrates that luxury buyers value both dependability and ownership experience. The brand’s electrified vehicles now account for 52% of total sales globally, with powerful performance in North America (379,589 units) and Europe (82,571 units, up 19.3%).
Subaru: The Reliability Champion
Satisfaction: 68% (6th) | Reliability Score: 68 (1st) | Global Sales: 936,375 units
Subaru leads all brands in reliability while maintaining solid satisfaction scores. Their global sales reached 936,375 vehicles for $31 billion in revenue in 2024. In the U.S., Subaru achieved a 5.6% sales increase to 667,725 vehicles with the Crosstrek (181,811 units) and Forester (175,521 units) leading the lineup. The brand’s commitment to all-wheel drive and safety continues to resonate with buyers who seek for dependable transportation.
BMW: Satisfaction Leader with Solid Reliability
Satisfaction: 73% (2nd) | Reliability Score: 53 (8th) | Global Sales: 2,450,804 units
BMW ranks second in satisfaction while maintaining respectable reliability. Global sales reached 2.45 million vehicles in 2024, though down 4% from 2023 due to production challenges and reduced Chinese demand. Electric vehicle sales grew 13.5% to 426,594 units, representing 17.4% of total sales. In the U.S., BMW achieved its second consecutive record year with 371,346 vehicles sold.
The Electric Vehicle Phenomenon
Rivian: Maximum Satisfaction, Minimum Reliability
Satisfaction: 86% (1st) | Reliability Score: 14 (22nd) | Global Sales: 51,579 units
Rivian tops satisfaction rankings but finishes last in reliability. The startup delivered 51,579 vehicles in 2024, up 3% from 2023 with strong performance in comfort, usability and ownership costs. Despite production challenges including motor part shortages, Rivian’s innovative features and customer service approach generate exceptional owner loyalty. The company secured $5.8 billion in joint venture funding from Volkswagen and a $6.6 billion loan from the DOE.
Tesla: High Satisfaction, Low Reliability
Satisfaction: 72% (3rd) | Reliability Score: 36 (17th) | Global Sales: 1,789,226 units
Tesla maintains strong owner satisfaction despite reliability challenges. Global deliveries reached 1.79 million vehicles in 2024, marking the first annual decline since 2011 (down 1.1%). The Model Y and Model 3 continue to dominate Tesla’s lineup, while “Other Models,” including the Cybertruck, contributed 85,133 deliveries. Revenue reached $97.7 billion, despite a decline in sales.
Traditional Reliability Leaders
Toyota: The Dependable Giant
Satisfaction: 67% (11th) | Reliability Score: 62 (3rd) | Global Sales: 10,159,336 units
Toyota combines strong reliability with solid satisfaction, maintaining its position as the world’s largest automaker. Global sales of Lexus reached 10.16 million vehicles in 2024, a 1.4% decrease due to certification issues in Japan. The brand sold 4.53 million electrified vehicles globally, accounting for 40.8% of the total volume. Toyota’s hybrid technology continues driving growth, particularly in North America and Europe.
Honda: Consistent Performance
Satisfaction: 66% (12th) | Reliability Score: 59 (4th) | Global Sales: 1,423,857 units (U.S.)
Honda delivers reliable vehicles that consistently receive high owner satisfaction ratings. U.S. sales increased 8.8% to 1.42 million vehicles in 2024, with the CR-V achieving record sales of 402,791 units. The brand set records for both hybrid sales (308,000+ units) and EV sales (33,000+ units). Honda’s motorcycle business also achieved record sales with 19.6 million units globally.
Premium Brand Analysis
Genesis: Luxury Market Contender
Satisfaction: 68% (7th) | Reliability Score: 40 (14th) | Estimated Global Sales: 200,000+ units
Genesis maintains a appreciable balance of good satisfaction with moderate reliability as Hyundai’s luxury division. The brand has sold over 1 million vehicles globally since its 2015 launch, with the G80 sedan approaching 500,000 cumulative sales. U.S. sales jumped from 1,623 units in January 2025 to 8,076 units in April, indicating strong momentum.
Cadillac: American Luxury Renaissance
Satisfaction: 65% (13th) | Reliability Score: 27 (21st) | Global Sales: 160,204 units (U.S.)
Cadillac achieved its best sales performance since 2016 with 9% growth in 2024. U.S. sales reached 160,204 vehicles, driven by strong performance from the Escalade (41,001 units) and Lyriq EV (28,402 units). The brand’s retail sales surged 11.5% with particular strength in California (up 23%).
Mass Market Brands
Chevrolet: Volume Leader
Satisfaction: 70% (5th) | Reliability Score: 37 (16th) | Global Sales: 1,745,809 units (U.S.)
Chevrolet ties for fourth in satisfaction despite lower reliability rankings. U.S. sales increased 1.5% to 1.75 million vehicles, with the Trax leading small SUV sales (up 84%)—the Silverado family (560,264 units) and Equinox (207,730 units) drive volume.
Ford: American Workhorse
Satisfaction: 67% (8th) | Reliability Score: 44 (13th) | Global Sales: 2,078,832 units (U.S.)
Ford strikes a balance between moderate satisfaction and reliability, ranking in the middle of the pack. U.S. sales grew 4.2% to 2.08 million vehicles, marking the best performance since 2019. Electrified vehicle sales surged 38% to 285,291 units, with the F-150 Lightning (33,510 units) and Mustang Mach-E (51,745 units) leading EV growth.
Import Brand Performance
Mazda: Efficiency Focus
Satisfaction: 61% (16th) | Reliability Score: 55 (6th) | Global Sales: 1,277,578 units
Mazda combines solid reliability with moderate satisfaction. Global sales increased 2.6% to 1.28 million vehicles, with the CX-5 (345,209 units) and CX-30 (234,295 units) leading worldwide. U.S. sales achieved a record 424,379 vehicles (up 16.8%).
Volkswagen: German Engineering Challenges
Satisfaction: 54% (21st) | Reliability Score: 34 (18th) | Global Sales: 9,027,400 units
The Volkswagen Group struggles in both satisfaction and reliability, despite its massive global scale. The Group delivered 9.03 million vehicles worldwide (down 2.3%), with weakness in China offsetting growth in North and South America. Electric vehicle sales declined 3.4% to 744,800 units.
Luxury and Near-Luxury Segment
Volvo: Scandinavian Safety
Satisfaction: 63% (15th) | Reliability Score: 38 (15th) | Global Sales: 763,389 units
Volvo achieved record global sales of 763,389 vehicles (up 8%) while maintaining mid-pack satisfaction and reliability ratings. Electrified models accounted for 46% of sales, with fully electric cars growing 54% to 175,194 units. European sales surged 25% to 369,685 vehicles.
Acura: Honda’s Premium Division
Satisfaction: 61% (17th) | Reliability Score: 55 (5th) | Global Sales: 132,367 units (U.S.)
Acura demonstrates strong reliability but moderate satisfaction. U.S. sales declined 9.1% to 132,367 vehicles, with traditional sedans struggling while SUVs maintained strength.
Infiniti: Nissan’s Luxury Arm
Satisfaction: 54% (20th) | Reliability Score: 48 (12th) | Global Sales: 58,070 units (U.S.)
Infiniti faces challenges in both satisfaction and sales volume. U.S. sales contracted 10.2% to 58,070 vehicles, with only the QX50 showing growth (up 7.9%). The QX60 remains the volume leader with 27,808 units.
Truck and SUV Specialists
GMC: Professional Grade
Satisfaction: 67% (9th) | Reliability Score: 33 (20th) | Global Sales: 614,117 units (U.S.)
GMC achieved record sales in 2024 with strong satisfaction but poor reliability. U.S. sales grew 9% to 614,117 vehicles, with the Sierra truck line (322,946 units) driving volume. The brand expanded globally into China, Australia, and New Zealand.
Jeep: Trail-Rated Challenges
Satisfaction: 51% (22nd) | Reliability Score: 33 (19th) | Global Sales: 587,725 units (U.S.)
Jeep ranks last in satisfaction while also struggling with reliability. U.S. sales declined 9% to 587,725 vehicles, though the brand maintains a strong PHEV market share with the Wrangler 4xe and Grand Cherokee 4xe. The Grand Cherokee (216,148 units) remains the top seller despite a 12% decline.
Value Brands
Kia: Value and Reliability
Satisfaction: 64% (14th) | Reliability Score: 51 (9th) | Global Sales: 3,089,457 units
Kia set a global sales record with 3.09 million vehicles while balancing satisfaction and reliability. The Sportage SUV (587,717 units) leads global sales, followed by the Seltos (312,246 units) and Sorento (280,705 units). Strong performance in markets outside Korea offset domestic decline.
Hyundai: Innovation Focus
Satisfaction: 67% (10th) | Reliability Score: 50 (10th) | Global Sales: 4,141,791 units
Hyundai maintains balanced performance in both metrics. Global sales declined 1.8% to 4.14 million vehicles, with strong growth in North America offsetting weakness in China and Korea. The brand’s electrification strategy shows 24.4% growth in eco-friendly U.S. sales.
Nissan: Struggling Giant
Satisfaction: 54% (20th) | Reliability Score: 48 (12th) | Global Sales: 3,348,687 units
Nissan shows moderate reliability but low satisfaction. Global sales were flat at 3.35 million vehicles, with strength in North America offset by a 12% decline in China. The U.S. (924,008 units) remains the largest market.
Buick: Quiet Luxury
Satisfaction: 59% (19th) | Reliability Score: 48 (11th) | Global Sales: 183,421 units (U.S.)
Buick demonstrates moderate reliability but struggles to meet customer satisfaction. U.S. sales grew 10% to 183,421 vehicles, driven by the Envista (51,316 units) and Envision (47,340 units). The brand completed a total redesign in 2024.
Buying Recommendations by Priority
For Maximum Reliability: Subaru, Lexus, Toyota, Honda
These brands consistently deliver dependable vehicles with lower repair costs and higher values of resale. Subaru leads with a perfect reliability score of 68 while maintaining solid owner satisfaction.
For Highest Satisfaction: Rivian, BMW, Tesla, Lexus
Suppose you prioritize the ownership experience and cutting-edge features over long-term reliability. In that case, these brands generate the most enthusiasm among their owners.
For Best Overall Balance: Lexus, Subaru, BMW, Toyota
These brands successfully combine strong reliability with high owner satisfaction, making them ideal for buyers who want both dependability and enjoyment.
For Value Buyers: Kia, Hyundai, Mazda
These brands offer competitive reliability and decent satisfaction at more accessible price points which provides excellent long-term ownership value.
Conclusion
The 2024 Consumer Reports data reveals that the automotive industry offers distinct choices for different buyer priorities. Traditional Japanese and Korean brands continue excelling in reliability, while premium and electric vehicle manufacturers lead in owner satisfaction. The most successful brands, such as Lexus and Subaru, prove that compromise isn’t necessary – it’s possible to deliver both dependable transportation and an enjoyable ownership experience.
For car buyers, this data is a suggestion that carefully considers your priorities is essential. If you plan to keep vehicles for the long term and prioritize minimal maintenance, reliability leaders like Subaru and Toyota offer the best value. If you prefer the latest technology and don’t mind occasional service visits, satisfaction leaders like BMW and Tesla provide more engaging ownership experiences. The sweet spot lies with brands like Lexus and Honda that successfully balance both attributes.
What factors contribute to owner satisfaction versus reliability in car brands?
Understanding Owner Satisfaction vs. Reliability in Car Brands
When choosing a car, it’s important to distinguish between owner satisfaction and reliability. While they often overlap, these two qualities are shaped by different factors and can lead to very different experiences for car owners.
What Drives Owner Satisfaction?
Owner satisfaction reflects how much drivers enjoy their vehicles and whether they would repurchase the same car. Key factors include:
Driving Experience: Smooth handling, acceleration, braking, and overall performance contribute strongly to satisfaction.
Comfort & Interior Quality: Seat comfort, cabin materials, noise insulation and ease of use of controls and infotainment systems.
Design & Style: Exterior appearance and interior layout, including color options and modern features.
Technology & Features: Advanced driver-assistance systems, connectivity, infotainment and convenience features.
Cost of Ownership: Perceived value for money, including purchase price, fuel economy and maintenance costs.
Brand Image: Emotional connection, prestige, and trust in the brand.
Customer Service: Dealer experience, warranty coverage, and after-sales support.
Owner satisfaction is ultimately about whether the car meets or exceeds the owner’s expectations in daily use, not just how often it breaks down1.
What Determines Reliability?
Reliability measures how consistently a vehicle operates without problems over time. It is typically based on:
Mechanical & Electrical Durability: Frequency of issues with engine, transmission, electronics, and other major systems.
Build Quality: Manufacturing consistency, material quality, and assembly standards.
Maintenance Requirements: How often repairs are needed and how costly or complex they are.
Recall History: Frequency and severity of recalls for safety or quality issues.
Component Quality: The durability of parts like brakes, suspension, and fuel systems.
Model Age & Updates: Newly redesigned models often have more initial issues, while established models tend to be more reliable.
Owner Maintenance: How well the vehicle is maintained by its owner (following service schedules, using quality parts).
Some brands (e.g., Tesla, Rivian) score high on satisfaction due to their innovative products and driving excitement but may lag in reliability due to frequent issues or recalls.
Others (e.g. Toyota, Honda) are renowned for reliability which leads to high satisfaction among those who prioritize dependability. However, they may not always excite in terms of design or technology.
Insights for Car Buyers
If you value a trouble-free experience and low long-term costs, prioritize brands with high reliability ratings.
If you want a car that feels special to drive and own, consider satisfaction scores but be aware of potential reliability trade-offs.
The best brands often strike a balance between both which offers dependable vehicles that are also enjoyable and rewarding to own.
By understanding these differences, buyers can make more informed decisions that align with priorities and needs.
Why Hybrid Owners Report Higher Satisfaction Than Electric or Gas Vehicle Owners?
Recent industry studies show that hybrid vehicle owners consistently report higher satisfaction than those who own either fully electric (EV) or traditional gasoline-powered cars. This trend is evident across both mass-market and luxury segments with hybrids scoring an average satisfaction rating of 82 out of 100 and it can be compared to 80 for gas vehicles and 77 for EVs.
Reasons for Higher Hybrid Owner Satisfaction
1. Balance of Practicality and Innovation
Hybrids provide the best of both worlds: They combine the fuel savings and environmental benefits of electrification with the familiar convenience and range of gasoline engines.
Owners appreciate reduced emissions and lower fuel costs without the need to change their driving habits or worry about charging infrastructure.
2. Reliability and Fewer Ownership Hassles
Hybrids are among the most reliable vehicles on the road. They match or exceed the reliability of gas cars and outperform EVs and plug-in hybrids, which are more prone to technical issues.
Fewer unexpected repairs and lower maintenance costs contribute to peace of mind and long-term satisfaction.
3. No Range Anxiety
No need to plug in: Hybrids recharge their batteries as you drive, eliminating concerns about driving range or finding charging stations—a common source of stress for EV owners.
This flexibility is especially valued in regions with limited charging infrastructure.
4. Superior Fuel Efficiency and Cost Savings
Significant fuel savings: Hybrid owners consistently report being more satisfied with their mileage which is often achieving double the MPG of comparable gas vehicles.
Lower fuel costs and reduced emissions make hybrids attractive to both eco-conscious and budget-minded drivers.
5. Strong Value and Resale
High resale values: Hybrids, especially those from brands like Toyota and Honda, retain their value better than many gas or electric models, which further boosts owner satisfaction.
Owners feel confident in their investment, knowing their vehicle will hold value over time.
6. Smooth Driving Experience
Better performance: Many hybrids deliver smoother acceleration and quieter operation than traditional gas cars which enhances daily driving enjoyment.
Owners often cite the seamless transition between electric and gas power as a positive feature.
Additional Insights
Environmental Impact: Hybrid owners often feel good about reducing their carbon footprint without sacrificing convenience.
Dependability: Top hybrid models (e.g., Toyota RAV4 Hybrid, Lexus NX, Honda Accord Hybrid) are frequently ranked among the most reliable vehicles overall.
Lower Ownership Costs: Maintenance and repair costs for hybrids are typically lower than for EVs (which can have expensive battery or electrical issues) and in many cases, lower than for gas cars.
How Comfort and Ownership Costs Influence Owner Satisfaction in Car Brands?
Comfort is a core factor that forms how satisfied owners feel about their vehicles. It covers aspects such as:
Seating quality and ergonomics: Supportive, adjustable seats reduce fatigue and make long drives more enjoyable.
Ride smoothness: A well-tuned suspension absorbs road imperfections which provides a relaxed experience.
Cabin quietness: Effective noise insulation and soundproofing create a peaceful environment, minimizing wind, road and engine noise.
Climate control: Advanced systems maintain ideal temperatures for all occupants which further enhances comfort.
Interior space and design: Generous legroom, headroom and intuitive control layouts make the car more user-friendly and enjoyable.
Technological features: Amenities such as heated and ventilated seats, premium audio and user-friendly infotainment systems uplift the sense of luxury and ease of use.
Owners consistently report higher satisfaction when their vehicles are comfortable as this directly impacts daily enjoyment and reduces driver fatigue. Comfort is weighted heavily in owner satisfaction surveys with brands excelling in comfort (such as Lexus and BMW) often achieving higher overall satisfaction scores.
The Impact of Ownership Costs on Satisfaction
Ownership costs refer to all expenses incurred during a vehicle’s lifespan, including:
Depreciation: The loss in value over time often the largest single cost.
Maintenance and repairs: Regular servicing, unexpected repairs and parts replacements.
Insurance: Varies by vehicle type, location, and driver profile.
Fuel or electricity: Ongoing costs for operation.
Taxes and fees: Registration, licensing and other government charges.
Financing: Interest paid on loans or leases.
High ownership costs can significantly lower satisfaction, especially if expenses exceed expectations. For example:
The average annual cost to own and operate a new vehicle in the U.S. reached over $12,000 in 2024, with depreciation alone accounting for nearly $4,700 per year.
Unexpected repair bills, high insurance premiums, or poor fuel economy can lead to frustration and regret, even if the car is otherwise enjoyable to drive.
Brands that offer lower total ownership costs—through strong reliability, affordable maintenance and slow depreciation—tend to have more satisfied owners. This is why brands like Toyota, Honda and Subaru which are known for low running costs and high resale values. They consistently score well in satisfaction surveys.
Combined Influence: Comfort and Costs in Brand Rankings
Surveys show that brands excelling in both comfort and cost control achieve the highest owner satisfaction. For instance:
Luxury brands often lead in comfort but can have higher ownership costs, which may offset some satisfaction for cost-conscious buyers.
Mass-market brands that balance comfort with low running costs (like Toyota and Subaru) often top satisfaction charts, especially among mainstream buyers.
Key Takeaways for Car Buyers
Prioritize comfort features if daily enjoyment and reduced fatigue are important to you.
Research total ownership costs—not just the purchase price—to avoid surprises.
Consider brands with a strong track record for both comfort and affordability to maximize satisfaction with your purchase.
A car that is both comfortable and affordable to own is likely to leave you happy years down the road.


