
Infographics
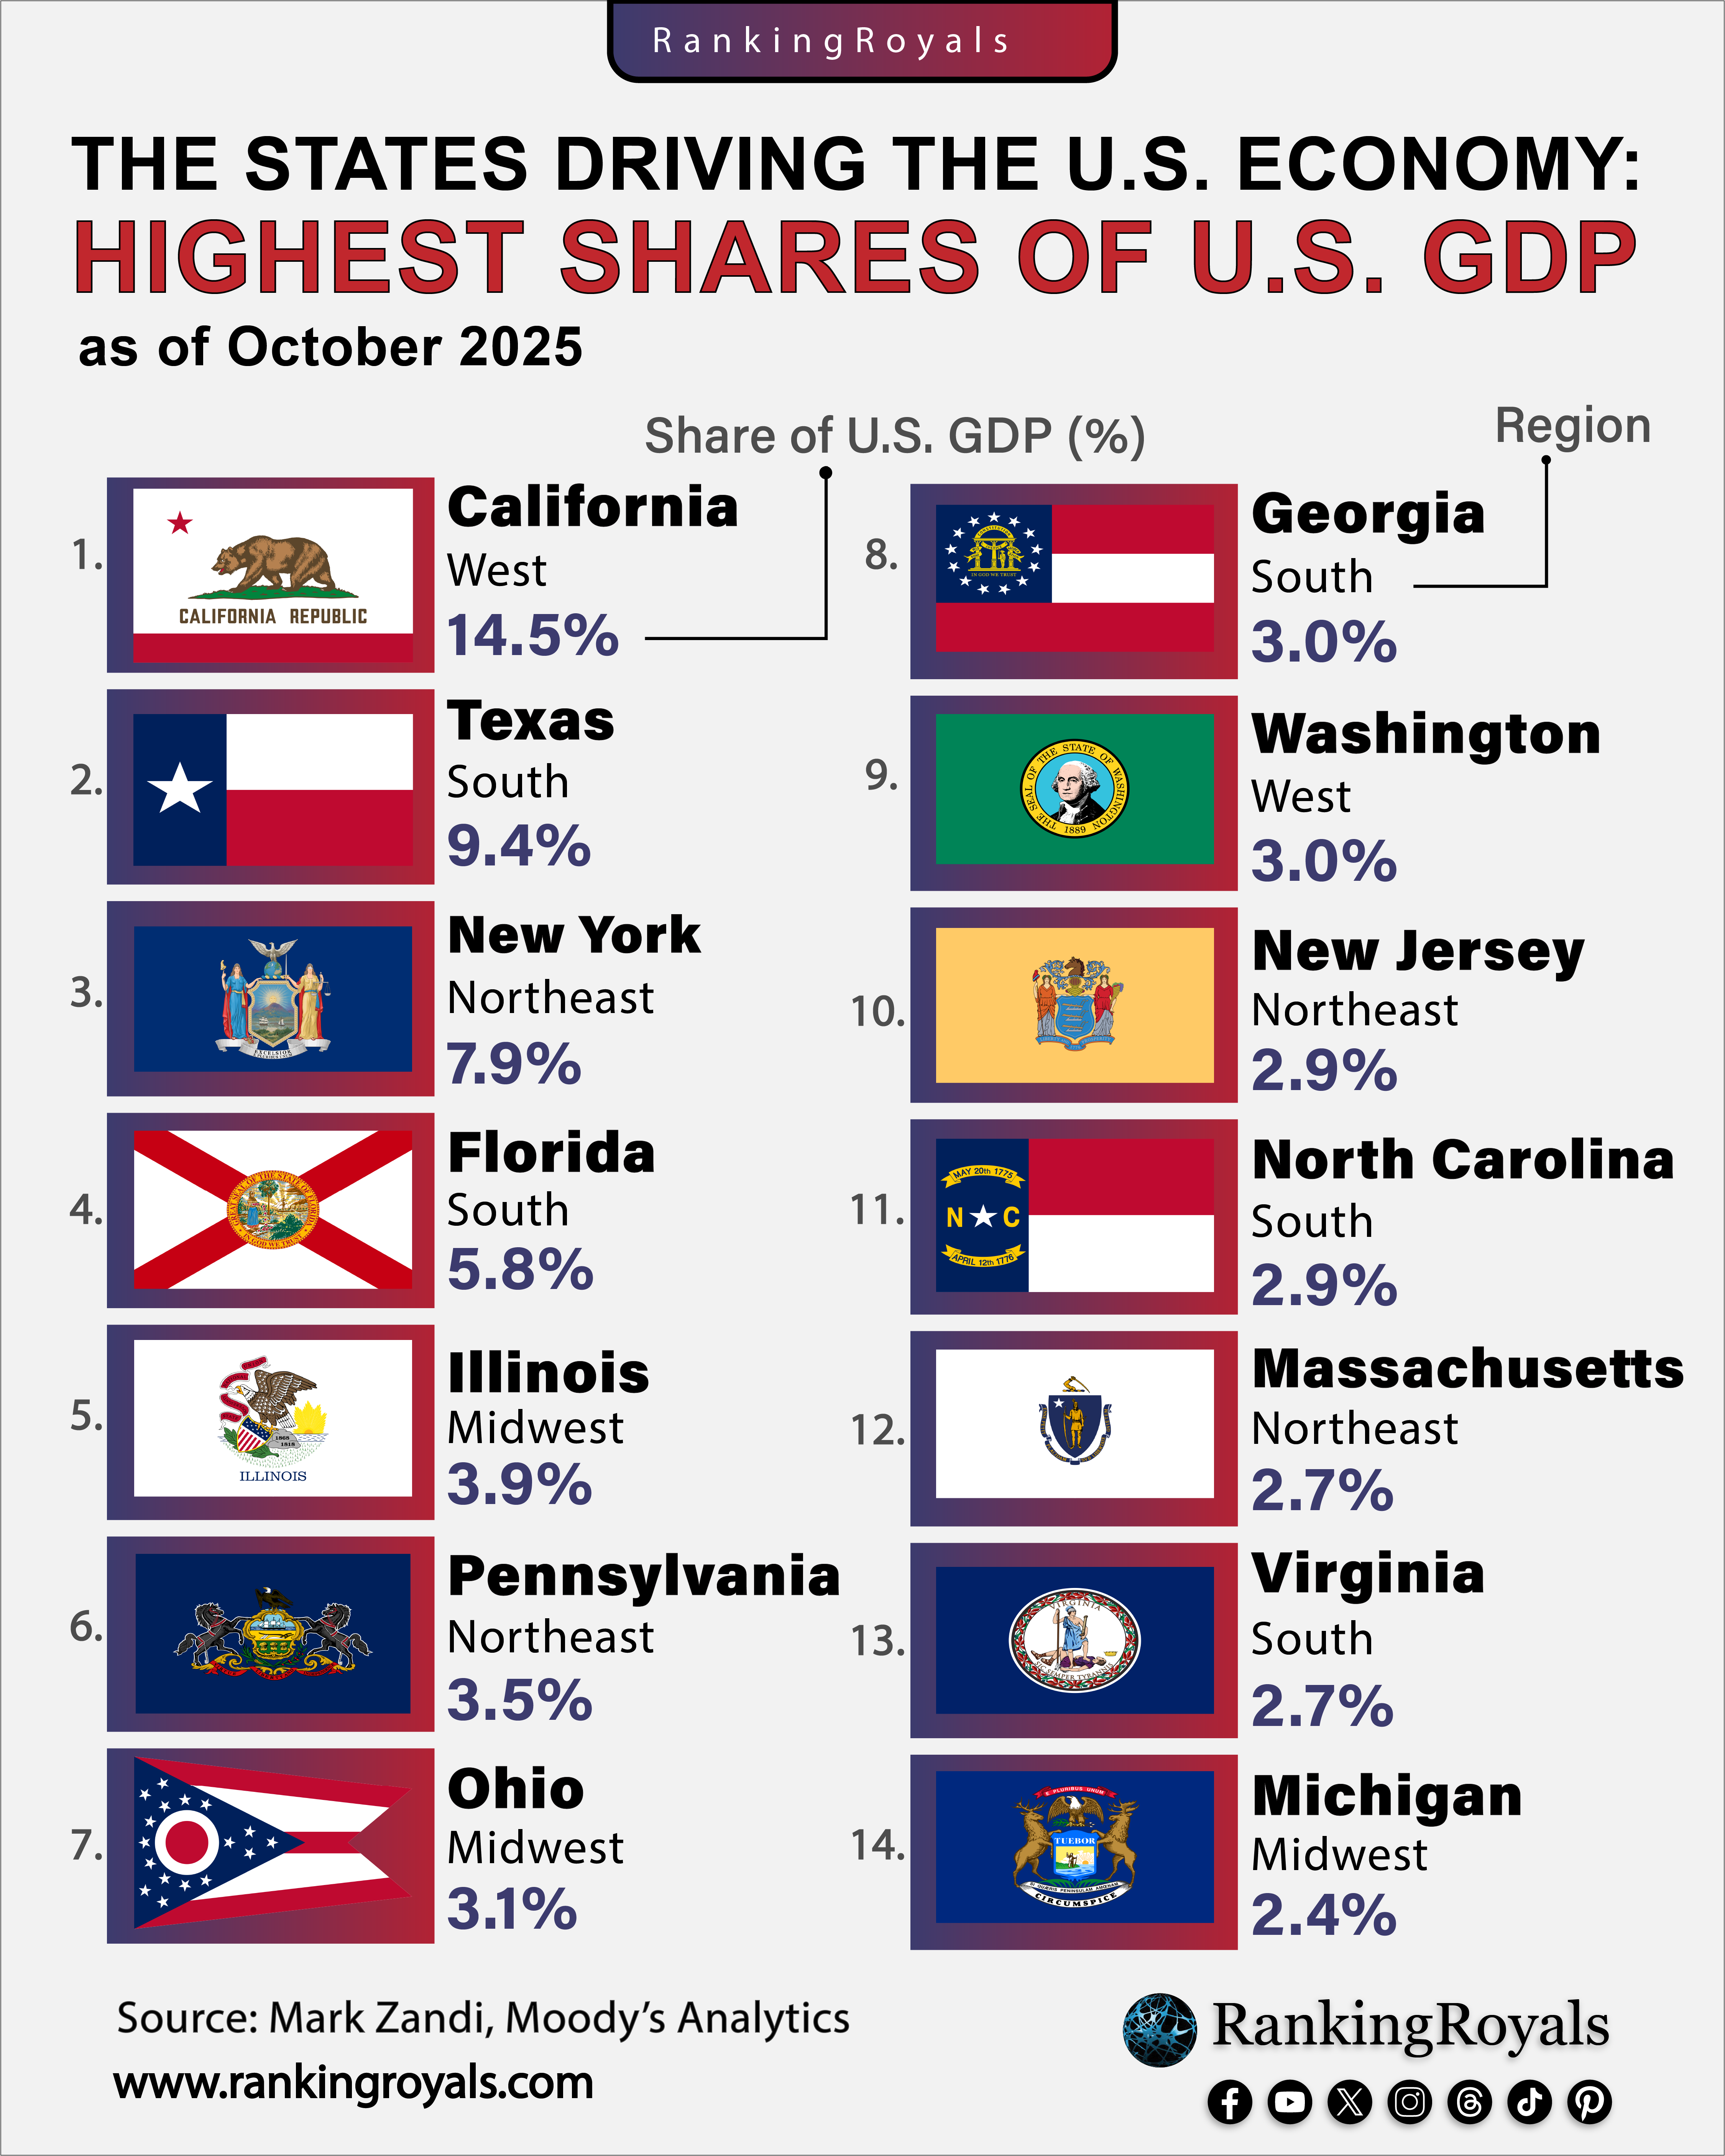
The States that Driving the American Economy: Highest Shares of U.S. GDP by State
1. California: The $4.1 Trillion Giant (14.5% of U.S. GDP)
California’s $4.1 trillion economy ranks as the world’s fourth largest, ahead of Japan, Germany, and every country except the U.S., China, and India. In 2024, the state grew by 6%, beating the U.S. (5.3%), China (2.6%), and Germany (2.9%). While Silicon Valley leads the way, California’s strength also comes from entertainment, agriculture, and manufacturing.
Apple, Alphabet, and Nvidia are among 58 Fortune 500 companies based in California. The tech sector adds nearly $1 trillion, or about 30% of the state’s GDP. Hollywood drives global entertainment, and the Central Valley grows more than half of America’s fruits and vegetables.
Manufacturing provides jobs for 1.1 million Californians at 36,000 companies, matching the industrial output of some countries. California sends $83 billion more to the federal government than it gets back, helping to support other states. In 2025, the information sector alone generated $538 billion.
Population and Economic Profile: California has about 39.5 million people, making it the most populous state in the country. In 2024, its GDP per capita was $85,340 in real terms ($103,788 nominal), ranking 4th in the nation and well above the national average. The biggest contributors to the state’s economy are professional and business services ($548.9 billion), information ($475.7 billion), and real estate ($446.3 billion). This mix of industries helps California stay strong across many high-value sectors, with per capita output higher than most developed countries. However, the state’s wealth is unevenly distributed, and the cost of living is much higher than the national average, especially in coastal cities where most economic activity happens.
- California sends $83 billion more annually to the federal government than it receives—the highest net contributor among all states
- The tech sector, worth ~$1 trillion, represents 30% of the state’s economy, making it larger than most countries’ entire GDP
- 36,000 manufacturing firms employ 1.1 million Californians, exceeding the manufacturing workforces of most developed nations
- Central Valley produces over 50% of the nation’s fruits, nuts, and vegetables despite comprising only 3% of the nation’s farmland nationally.
- GDP per capita of $103,788 (nominal) ranks 4th nationally, exceeding most developed nations on a per capita basis
California is genuinely the world’s 4th largest economy after the U.S., China, and India—surpassing Japan’s $4.02 trillion in 2024. The state’s 6% growth rate in 2024 exceeded the U.S. (5.3%), China (2.6%), and Germany (2.9%), demonstrating outsize economic momentum. California is home to 58 Fortune 500 companies, anchoring the tech, entertainment, agriculture, and manufacturing sectors. The information sector alone generated $538 billion in 2025, making it comparable to many nations’ entire economies. California’s education and research ecosystem attracts venture capital concentrated nowhere else—the state captures roughly one-third of all U.S. venture funding.
2. Texas: Energy and Export Powerhouse (9.4% of U.S. GDP)
Texas accounts for 9.4% of U.S. output and has a $2.7 trillion GDP—the world’s 8th-largest economy and larger than Brazil’s. Governor Abbott added 2.5 million jobs, making Texas the nation’s job growth leader for three consecutive years. The state produces 43% of U.S. crude oil and 27% of natural gas, yet diversification into tech, finance, and manufacturing is accelerating.
Energy paid a record $27.3 billion in state taxes during fiscal 2024. But Texas also exported $455 billion in goods in 2024—accounting for approximately 22% of all U.S. exports. Zero state income tax has triggered a corporate migration wave, with 54 Fortune 500 companies now headquartered in Texas—more than any state.
Manufacturing, finance, and technology are reshaping the economy beyond energy. The state operates 34 refineries processing one-third of the national capacity. Austin rivals Silicon Valley as a tech hub, while Dallas and Houston anchor financial services and corporate headquarters.
Population and Economic Profile: Texas’s population reached approximately 31.0 million in 2024, making it the nation’s second-most populous state after California. The state’s GDP per capita stands at $69,425 in real terms ($87,387 nominal), ranking 14th nationally—below the national average but reflecting rapid population growth that outpaces economic expansion. Per capita personal income of $67,942 places Texas 28th among states, though the absence of state income tax significantly boosts take-home pay. Professional and business services lead GDP contribution ($309.2 billion), followed by real estate ($281.4 billion) and manufacturing ($239.3 billion), demonstrating economic diversification beyond energy. The state’s median household income of $76,292 is below the national average, while its 13.8% poverty rate is above the 12.4% national figure, indicating challenges in wealth distribution despite aggregate economic strength.
- Texas produces 43% of U.S. crude oil and 27% of natural gas globally, more than most OPEC members
- Oil and gas industry paid a record $27.3 billion in state taxes in FY2024, shattering the previous record by nearly $1 billion
- Texas accounts for approximately 22% of all U.S. exports ($455 billion in 2024), positioning it as America’s top exporting state
- Zero state income tax has attracted 54 Fortune 500 companies, triggering an exodus from California and New York
- 492,000 Texans work in the oil/gas sector, earning an average of $128,255 annually, 76% above the state’s private sector average
Texas is the world’s 8th largest economy, larger than Brazil, Canada, and South Korea combined. The state added 2.5 million jobs since 2015, more than any competitor state, driving net in-migration from California and New York. Texas exports $455 billion annually (approximately 22% of U.S. total), making it America’s top exporting state by wide margin. The oil and gas sector paid record $27.3 billion in taxes during FY2024 despite broader industry volatility. Real GDP growth hit 4.8% in 2024, nearly double the national average, with Q4 2024 showing 3.5% annualized expansion.
3. New York: Financial Capital of the World (7.9% of U.S. GDP)
New York contributes 7.9% of U.S. GDP with $2.3 trillion state output, driven almost entirely by NYC’s unmatched position as global finance capital. Manhattan generates 73% of New York City’s $1.286 trillion GDP—making a single borough larger than most American state economies. The New York Stock Exchange and Nasdaq—the world’s two largest exchanges—remain irreplaceable to global finance.
Wall Street profits surged to $41.7 billion in 2024 after pandemic lows, with 330,000+ financial services workers generating 29.2% of state output. Professional services contributed $268.7 billion and healthcare substantial employment across major medical centers and hospitals.
Commercial real estate distress continues post-pandemic, and the financial sector lost 7,100 net jobs in the first ten months of 2024. Fintech automation and remote work adoption threaten traditional office employment, though NYC’s unparalleled talent concentration and infrastructure remain irreplaceable.
Population and Economic Profile: New York’s population stands at approximately 19.5 million, making it the nation’s 4th most populous state despite recent modest declines. The state boasts the nation’s highest GDP per capita at $92,341 in real terms ($117,332 nominal), reflecting extraordinary wealth concentration in New York City and surrounding counties. Per capita personal income reached $85,733 in 2024, second only to Connecticut nationally and 18% above the national average. Finance and insurance account for the largest share of GDP ($326.4 billion), followed by professional and business services ($268.7 billion) and real estate ($255.9 billion), indicating intense specialization in high-value services. This concentration creates stark geographic inequality—downstate regions, including NYC, generate vastly higher incomes than upstate areas, contributing to population shifts and economic challenges in non-metropolitan regions. The state’s exceptionally high cost of living, particularly in Manhattan and surrounding boroughs, offsets nominal income advantages.
- Manhattan’s single borough generates 73% of New York City’s $1.286 trillion economy—larger than any individual U.S. state except California, Texas, and Florida
- Wall Street profits rebounded to $41.7 billion in 2024 from pandemic lows, representing extraordinary profit concentration in single sector
- Financial services employ 330,000+ people (29.2% of state output), more than triple the national average concentration
- New York City’s real estate, finance, and professional services sectors alone generate more economic output than most nations
- GDP per capita of $117,332 (nominal) ranks 1st nationally, with only Connecticut and Massachusetts approaching similar levels
New York City’s economy generates $2.299 trillion in metropolitan area output—ranking it globally among the world’s top 10 national economies. Manhattan alone accounts for 73% of NYC’s $1.286 trillion GDP, making it larger than most U.S. states and comparable to entire developed nations. Financial services comprise 29.2% of New York state output—nearly triple the national average—making Wall Street’s health absolutely critical to regional prosperity. The NYSE and Nasdaq remain the world’s two largest stock exchanges, anchoring an irreplaceable concentration of financial talent and capital. Wall Street profits hit $41.7 billion in 2024, demonstrating the sector’s continued vitality despite ongoing commercial real estate challenges.
4. Florida: Tourism and Population Boom (5.8% of U.S. GDP)
Florida accounts for 5.8% of the national GDP with a $1.726 trillion economy fueled by record tourism and the nation’s fastest population growth. The state welcomed 142.9 million visitors in 2024—the highest ever—generating $133.6-134.9 billion in economic impact and $17.4 billion in state/local taxes. Tourism supports 1.7 million jobs statewide, saving 9+ million households approximately $2,000 annually in taxes.
Population growth turbocharges the economy. Florida added approximately 365,000 net new residents in 2024—more than any other state—creating sustained demand for housing, healthcare, retail, and services. The absence of state income tax attracts retirees and high earners fleeing northeastern states.
Healthcare grows rapidly as Florida’s population ages. Miami-Dade County alone welcomed a record 28 million visitors in 2024. Central Florida’s tourism generates $94.5 billion in impact while supporting 37% of regional jobs—the highest tourism concentration of any major U.S. metro.
Population and Economic Profile: Florida’s population reached approximately 23.0 million in 2024, making it the nation’s third-most populous state and the fastest-growing large state. The state’s GDP per capita stands at $57,317 in real terms ($75,074 nominal), ranking 34th nationally—well below the national average but rising rapidly due to population growth. Per capita personal income of $70,390 ranks 24th nationally, though the lack of state income tax significantly enhances take-home earnings compared to other high-income states. Real estate leads GDP contribution ($479.2 billion), followed by professional and business services ($274.3 billion) and leisure/hospitality ($156.8 billion). Tourism and real estate together account for approximately 35% of state GDP, creating heavy dependence on these cyclical sectors. The state’s median household income of $71,624 sits slightly below the national average, though wealth inequality remains moderate compared to coastal states.
- Florida welcomed 142.9 million visitors in 2024, generating a record $133.6-134.9 billion in economic impact
- Tourism saves Florida’s 9+ million households ~$2,000 annually in taxes by generating $17.4 billion in state/local revenue
- Central Florida tourism supports 37% of all regional jobs—the highest tourism employment concentration of any major U.S. metro area
- Florida added approximately 365,000 net new residents in 2024—more than any other state—with population growth accelerating each decade
- Miami-Dade County alone attracted 28 million visitors in 2024, rivaling entire nations’ annual tourism numbers
Florida’s 142.9 million annual visitors in 2024 exceeded the entire U.S. population, generating record $133.6-134.9 billion in economic impact. Tourism directly supports 1.7 million jobs statewide while indirectly supporting millions more through supply chains and services. The state’s lack of income tax has proven transformative in attracting population and corporate relocations from high-tax northeastern states. Central Florida tourism supports 37% of all regional jobs—the highest concentration nationally—making the region almost entirely dependent on visitor spending. Florida’s population growth of approximately 365,000 net residents in 2024 exceeds most countries’ annual population gains and continues accelerating.
5. Illinois: Manufacturing and Finance Hub (3.9% of U.S. GDP)
Illinois contributes 3.9% of U.S. GDP with $1.148 trillion economy centered on Chicago’s $886 billion metro economy. Manufacturing remains the largest contributor to GDP at $110.7 billion, employing 574,700 people with average salaries of $106,763. Pharmaceuticals drove impressive Q2 2025 GDP growth of 4.8%—8th nationally.
The Chicago Mercantile Exchange (world’s largest futures exchange) anchors financial services generating $141.0 billion in 2024. Illinois hosts 32 Fortune 500 companies spanning finance, manufacturing, agriculture, and retail. But structural challenges persist: high taxes drive business out-migration, with growth ranking 45th nationally in 2023 at just 1.2%. Since 2019, Illinois GDP has grown only 6.78% versus 16.34% nationally, a gap highlighting the urgency of tax and regulatory reform. Population out-migration accelerates as residents seek lower-cost states.
Population and Economic Profile: Illinois’s population stands at approximately 12.6 million, making it the nation’s 6th most populous state with declining trends since 2010. The state’s GDP per capita reached $90,330 (nominal), ranking 8th nationally and exceeding the national average significantly. Per capita personal income of $74,197 ranks 13th among states. Professional and business services contribute the largest share ($285.7 billion), followed by financial services ($141.0 billion) and manufacturing ($110.7 billion), demonstrating economic strength centered on Chicago metropolitan area. Manufacturing concentration significantly exceeds national averages at 9.7% of state GDP, with pharmaceutical sector driving recent growth. Geographic inequality mirrors Texas—Chicago dominates state economy while downstate regions struggle with lower incomes and limited opportunities. The state’s high property taxes (among the nation’s highest) and flat income tax of 4.95% create affordability challenges despite above-average nominal incomes.
- Chicago economy of $886 billion alone exceeds 45 U.S. state economies, making it larger than most global economies
- Manufacturing contributes $135 billion annually (12.3% of GDP)—far above national manufacturing concentration of 8.4%
- Chicago Mercantile Exchange remains world’s largest futures exchange, dominating global derivative trading with 675+ million contracts annually
- Illinois ranked 45th in 2023 GDP growth (1.2%) despite strong pharmaceutical sector—reflective of broader structural challenges
- Since 2019, Illinois GDP grew 6.78% versus 16.34% nationally—a 9.56-point gap driven by high taxes and regulatory burden
Chicago’s economy of $886 billion places it among the world’s top national economies, ranking 11th globally if independent. Manufacturing contributes $135 billion annually (12.3% of Illinois GDP) and employs 574,700 people with above-average compensation. Illinois hosts 32 Fortune 500 companies, ranking fourth nationally, yet population out-migration continues due to the high tax burden. The Chicago Mercantile Exchange remains the world’s largest futures exchange, defining the state’s financial sector leadership. Illinois’s 2023 GDP growth rate of 1.2% ranked 45th nationally, far below the national average and reflecting structural economic challenges.
6. Pennsylvania: Healthcare Powerhouse (3.5% of U.S. GDP)
Pennsylvania accounts for 3.5% of U.S. GDP, with a gross state product of $836.5 billion, up 2.6% from 2024 to 2025. Healthcare dominates extraordinarily, the hospital sector alone contributed $168 billion (20% of GDP, with multiplier effects), employing 590,000 people and paying $38.2 billion in wages. Healthcare’s growth trajectory dwarfs other sectors, projected to add 64,860 jobs (1.2% annual growth) from 2018 to 2028.
Pharmaceutical manufacturing has emerged as nationally significant, though smaller than New Jersey’s cluster. Manufacturing across sectors contributed substantially in 2024, with the Lehigh Valley reaching a GDP of $56 billion. Unemployment fell to a record low 3.6% in 2024, though 85% of net job gains came from healthcare and leisure/hospitality—raising wage quality concerns.
Energy production from the Marcellus Shale, financial services in Philadelphia and Pittsburgh, and diverse manufacturing add breadth, yet concentration in lower-wage healthcare jobs limits wage growth across the economy.
Population and Economic Profile: Pennsylvania’s population stands at approximately 13.1 million, making it the nation’s 5th most populous state with gradual aging and declining workforce participation. The state’s GDP per capita reached $62,585 in real terms ($77,577 nominal), ranking 21st nationally—below the national average. Per capita personal income of $68,957 ranks 20th among states. Healthcare services lead GDP contribution at $168 billion (20% with multiplier effects), followed by professional and business services ($188.3 billion) and real estate ($142.8 billion). This heavy reliance on healthcare—projected to add 64,860 jobs through 2028—indicates a structural economic transition from manufacturing toward a service-based economy. The state’s median household income of $73,271 sits slightly below the national average, with modest wealth inequality compared to coastal states. Manufacturing remains important at 7.8% of GDP but faces ongoing restructuring challenges, with traditional steel and industrial sectors continuing to decline.
- Pennsylvania hospital sector alone contributed $168 billion to state economy—equaling 20% of state GDP with multiplier effects
- Healthcare employs 590,000 Pennsylvanians with $38.2 billion in annual wages, making it the state’s largest job-creating sector
- 85% of Pennsylvania’s net job gains in 2024 came from healthcare and leisure/hospitality—typically lower-wage sectors limiting real income growth
- Lehigh Valley GDP reached $56 billion in 2024, with manufacturing again driving growth in this diversified regional economy
- Unemployment fell to record low 3.6% in 2024, yet job quality concerns persist given healthcare/hospitality dominance
Pennsylvania’s hospital sector contributed $168 billion to the state’s economy, approximately 20% of GDP when multiplier effects were included—making healthcare extraordinarily important. Healthcare employs 590,000 Pennsylvanians with $38.2 billion in annual wages, ranking as the top job-creating industry. The state’s unemployment rate fell to record low 3.6% in 2024, yet 85% of job gains came from healthcare and hospitality sectors. Pharmaceutical manufacturing remains nationally significant, though concentrated below New Jersey’s cluster scale. Energy production from Marcellus Shale provides additional economic diversification beyond healthcare.
7. Ohio: Industrial Manufacturing Core (3.1% of U.S. GDP)
Ohio contributes 3.1% of U.S. economic output with $727.3 billion GDP, maintaining identity as America’s third-largest manufacturing state. Manufacturing generated $137.9 billion in 2024—16.5% of Ohio’s private economy—the largest sectoral share. The state employs 687,000 manufacturing workers (5.4% of all U.S. manufacturing), ranking third nationally in manufacturing employment.
Ohio fully recovered jobs lost to the COVID recession by May 2023 and hit historic employment peaks in March 2024—the first recovery of all jobs lost in the 2001 recession. Manufacturing spans primary metals, fabricated metals, machinery, transportation equipment, chemicals, plastics, food processing, and electrical equipment.
Ohio exported $56.6 billion in goods in 2024, ranking 10th nationally, with exports accounting for 6.4% of state GDP. Beyond manufacturing, the state developed strengths in financial services (8% of GSP), healthcare, and emerging technology. The creative sector generates $32.9 billion annually.
Population and Economic Profile: Ohio’s population stands at approximately 11.8 million, making it the nation’s 7th most populous state with slow growth. The state’s GDP per capita reached $68,315 in real terms ($79,452 nominal), ranking 18th nationally—slightly below the national average. Per capita personal income of $66,281 ranks 28th among states, reflecting a manufacturing-centered economy with moderate wages. Manufacturing accounts for the largest share of GDP at $137.9 billion (16.5%), followed by professional and business services ($122.8 billion) and real estate ($115.6 billion). This manufacturing concentration far exceeds the national average (8.4%), making Ohio heavily dependent on the health of the industrial sector. The state’s median household income of $71,155 sits slightly below the national average, with modest economic inequality. Manufacturing employment grew modestly, with the state successfully retaining automotive and industrial production despite Rust Belt challenges.
- Ohio ranks 3rd nationally in manufacturing employment with 687,000 workers—more than most developed nations’ entire manufacturing sectors
- Manufacturing contributes $137.9 billion (16.5% of economy)—the highest sectoral concentration of any major U.S. state
- Ohio fully recovered all jobs lost to 2001 recession by March 2024—unique among Rust Belt states and demonstrating manufacturing resilience
- Exports reached $56.6 billion in 2024 (6.4% of state GDP), with machinery, electrical equipment, and metals dominating
- Creative industries generate $32.9 billion annually—far exceeding manufacturing employment yet vastly smaller in economic output
Ohio ranks 3rd nationally in manufacturing employment with 687,000 workers and generates $137.9 billion in manufacturing GDP—the largest sectoral contribution. The state manufactures primary metals, fabricated metals, machinery, transportation equipment, chemicals, and electrical equipment across 13,000+ facilities. Ohio exported $56.6 billion in goods in 2024, ranking 10th nationally, with manufacturing accounting for the bulk of exports. Unemployment hit record low 3.3% in July 2023 before rising to 4.4% by June 2024 as workers re-entered labor force. Ohio represents a unique Rust Belt success story, fully recovering all jobs lost to 2001 recession by March 2024.
8. Georgia: Logistics and Film Hub (3.0% of U.S. GDP)
Georgia accounts for 3.0% of U.S. GDP with approximately $887.9 billion, driven by explosive growth in logistics, technology, and film production. Atlanta’s economy generates $473 billion alone, ranking 11th among U.S. cities and 22nd globally. The Port of Savannah (4th-largest U.S. container port) and Hartsfield-Jackson Atlanta International Airport (world’s busiest with 100+ million passengers) position Georgia as a global supply chain epicenter.
Technology has become central to growth, with Atlanta’s data center market ranking 7th nationally and rising. The metro area attracted 33 Fortune 1000 headquarters as of 2024—up from 26 pre-pandemic—including NCR Atleos, Chart Industries, and Mativ Holdings. Film and television production thrives thanks to competitive tax incentives. Manufacturing spans food processing (Georgia’s largest subsector), automotive, aerospace, and building materials. The state projects GDP growth of 2.4% in 2025, outpacing many competitors.
Population and Economic Profile: Georgia’s population reached approximately 11.2 million in 2024, making it the nation’s 8th most populous state with rapid growth averaging 1.4% annually. The state’s GDP per capita stands at $77,658 in real terms ($99,282 nominal), ranking 11th nationally—above the national average. Per capita personal income of $72,481 ranks 17th among states. Professional and business services lead GDP contribution ($243.7 billion), followed by real estate ($208.5 billion) and retail trade ($156.3 billion), demonstrating a diversified economy centered on Atlanta metropolitan area. The state’s growth trajectory significantly exceeds that of peer states, with population influx from other regions driving economic expansion. Atlanta’s economic leadership far exceeds other state regions, creating geographic concentration of wealth and opportunity. The state’s median household income of $79,355 exceeds the national average, and its wealth distribution is relatively balanced.
- Atlanta’s economy of $473 billion ranks 11th among U.S. cities and 22nd globally—exceeding most nations’ economies
- Hartsfield-Jackson Atlanta International Airport handles 100+ million passengers annually—the world’s busiest by massive margin
- Port of Savannah handles fourth-largest container volumes in U.S. with capacity expansions opening inland port in 2026
- Atlanta attracted 33 Fortune 1000 headquarters by 2024—up from 26 pre-pandemic, demonstrating corporate migration acceleration
- Film and television production generates billions in economic activity thanks to competitive tax incentives (average 30-35% rebates)
Atlanta’s economy of $473 billion ranks 11th among U.S. cities globally, exceeding the economies of most developed nations. Hartsfield-Jackson Atlanta International Airport handles over 100 million passengers annually, making it the world’s busiest airport by passenger traffic. The Port of Savannah ranks 4th among U.S. container ports and handles 40% of Southeast container traffic. Atlanta attracted 33 Fortune 1000 headquarters by 2024, up from 26 before the pandemic, as corporate relocations accelerated. Georgia’s film and television production sector generated billions through a competitive tax incentive structure that averaged 30-35% rebates.
9. Washington: Aerospace and Tech Center (3.0% of U.S. GDP)
Washington state contributes 3.0% of U.S. GDP with approximately $859.9 billion, powered by aerospace (Boeing) and technology (Microsoft, Amazon). The aerospace industry generates $71 billion in annual revenues, supports 194,000 jobs, and delivers $19.4 billion in labor income. Boeing employs 66,000 of Washington’s 77,400 aerospace workers, making the company’s health critical to regional prosperity.
Aerospace workers in Lynnwood-Everett spent $36.5 million on automobiles in 2023 alone, demonstrating exceptional purchasing power. Boeing and employees donated $43.9 million to Washington charities. Washington’s tech sector provides crucial diversification—representing 22% of state economy, the highest share of any state.
However, Boeing faces serious challenges. Quality issues, including 2024 safety incidents, threaten production levels and employment despite a strong order backlog of 6,156 unfilled orders. The aerospace supply chain struggles with workforce disruptions and global supply constraints.
Population and Economic Profile: Washington’s population reached approximately 7.9 million in 2024, making it the nation’s 13th-most populous state, with steady growth. The state’s GDP per capita stands at $98,452 in real terms ($124,789 nominal), ranking 2nd nationally—exceeded only by New York—reflecting extraordinary wealth concentration in tech and aerospace sectors. Per capita personal income of $88,563 ranks 5th among states, well above the national average. Information technology leads GDP contribution ($187.3 billion, representing 22% of the economy), followed by professional and business services ($146.8 billion) and real estate ($118.4 billion). The aerospace industry concentration creates unique vulnerability—Boeing’s operational challenges directly impact statewide prosperity. The state’s median household income of $95,827 ranks among the nation’s highest, reflecting a strong labor market and high-wage employment. Geographic concentration in the Seattle metropolitan area and the Puget Sound region creates economic inequality between urban and rural areas.
- Aerospace workers in Lynnwood-Everett spent $36.5 million on automobiles in 2023—equivalent to 1,160 vehicles sold or four dealerships’ annual sales
- Boeing accounts for 82% of aerospace industry revenues in Washington, 80% of jobs, 77% of labor income—nearly monopolistic concentration
- Washington exports more aerospace products annually than California, Texas, Georgia, Florida, South Carolina, Arizona, and Alabama combined
- Tech sector represents 22% of Washington state economy—the highest share of any state—with Microsoft and Amazon leading
- Aerospace industry generates $580 million+ in annual state tax revenue despite current production challenges
Boeing employs 66,000 of Washington’s 77,400 aerospace workers, making the company’s health absolutely critical to state prosperity. The aerospace industry generates $71 billion in annual business revenues and $19.4 billion in labor income. Washington exports more aerospace products annually than California, Texas, Georgia, Florida, South Carolina, Arizona, and Alabama combined. Tech sector represents 22% of Washington state economy—the highest share nationally, providing crucial economic diversification. Boeing’s 6,156 unfilled orders represent substantial future production despite recent quality and safety challenges.
10. New Jersey: Pharmaceutical Capital (2.9% of U.S. GDP)
New Jersey contributes 2.9% of U.S. GDP with approximately $851.9 billion, driven by the nation’s most concentrated pharmaceutical and life sciences cluster. The sector accounts for $120.9-130.8 billion in economic output—approximately 16% of state GDP. New Jersey reportedly has the world’s highest concentration of scientists and engineers, with life sciences employing 76,510 people (2.4% of private sector workers).
Industry giants Johnson & Johnson and Merck maintain headquarters here, anchoring an ecosystem that expanded 19.9% from 2015 to 2020. Major construction activity reflects continued investment: 71 life sciences projects exceeding $5 million each were initiated from 2019 to 2024, totaling $4.03 billion.
Financial services employ 218,000+ (6.8% of private sector jobs) and contribute $32 billion. Manufacturing beyond pharmaceuticals employs 253,000 across 9,800 establishments. High property taxes—the nation’s highest—remain a persistent challenge despite extraordinary compensation in life sciences.
Population and Economic Profile: New Jersey’s population stands at approximately 9.3 million, making it the nation’s 11th most populous state with modest growth. The state’s GDP per capita reached $85,167 in real terms ($108,461 nominal), ranking 5th nationally—among the highest in the nation. Per capita personal income of $82,104 ranks 7th among states, well above the national average. Life sciences (pharma and biotech) contribute $120.9-130.8 billion (16% of GDP), followed by professional and business services ($155.3 billion) and real estate ($134.7 billion). This extraordinary pharmaceutical concentration provides economic stability but creates sector dependence risk. The state’s median household income of $92,340 ranks among the highest nationally, reflecting high-wage employment concentration. New Jersey’s property taxes remain the nation’s highest, with effective tax rates 40% above national averages, creating affordability challenges despite exceptional nominal incomes and offsetting the wealth advantage.
- New Jersey has world’s highest concentration of scientists and engineers—life sciences employ 76,510 people (2.4% of private sector workforce)
- Life sciences contribute $120.9-130.8 billion to state economy (16% of GDP)—the highest concentration of any state
- 71 life sciences projects exceeding $5 million each were initiated 2019-2024, representing $4.03 billion in construction spending
- Johnson & Johnson and Merck headquarters anchor ecosystem expanded 19.9% from 2015-2020—among fastest-growing sectors
- Financial services employ 218,000+ (6.8% of private sector) with $32 billion contribution—second pillar of New Jersey economy
New Jersey has the world’s highest concentration of scientists and engineers, with life sciences employing 76,510 people and contributing $120.9-130.8 billion to the state economy. Johnson & Johnson and Merck & Co. Inc.—among the world’s largest pharmaceutical companies—maintain New Jersey headquarters. From 2019-2024, 71 life sciences projects exceeding $5 million each were initiated, representing $4.03 billion in construction spending. Life sciences account for 16% of state GDP—the highest concentration nationally—making pharmaceutical health absolutely critical to New Jersey. Financial services employ 218,000+ people with a $32 billion contribution, providing economic diversification.
11. North Carolina: Research Triangle Innovation (2.9% of U.S. GDP)
North Carolina claims 2.9% of U.S. GDP with $838.7-845.1 billion gross state product, driven by finance, technology, life sciences, and advanced manufacturing centered on the Research Triangle. Research Triangle Park—the nation’s largest research park—hosts 4,000+ technology firms and 600 life sciences companies, with 300+ based directly in RTP.
Three world-class universities anchor the Triangle: NC State, Duke, and UNC-Chapel Hill, attracting and retaining research talent. Charlotte emerged as the nation’s second-largest banking center after New York, home to Bank of America and Truist Financial, plus six other Fortune 500 companies.
Real GDP grew 3.5% in 2024, substantially exceeding national averages, with 68,100 net jobs added. Projections show 2.3% growth in 2025, the strongest in information (4.9%), construction (3.1%), and transportation/warehousing (2.7%). North Carolina’s pharmaceutical exports reached $12.7 billion in 2024, second only to Indiana nationally.
Population and Economic Profile: North Carolina’s population reached approximately 10.8 million in 2024, making it the nation’s 9th most populous state with rapid growth. The state’s GDP per capita stands at $74,562 in real terms ($94,843 nominal), ranking 15th nationally—above the national average. Per capita personal income of $72,143 ranks 18th among states. Professional and business services lead GDP contribution ($226.4 billion), followed by real estate ($184.7 billion) and manufacturing ($148.3 billion). Life sciences and technology sectors drive emerging growth, with Research Triangle Park hosting 4,000+ firms in biotechnology and information technology. The state’s median household income of $78,412 exceeds the national average, with balanced economic growth across regions beyond the Triangle. Manufacturing concentration at 12.7% of state GDP significantly exceeds national averages, ensuring industrial diversity alongside technology sector development.
- Research Triangle Park hosts 4,000+ technology firms and 600 life sciences companies—the nation’s largest research park by concentration
- Charlotte ranks 2nd nationally as banking center after New York, home to Bank of America and Truist Financial
- North Carolina pharmaceutical exports reached $12.7 billion in 2024—second only to Indiana nationally
- Corporate tax rate of 2.5% is the nation’s lowest, scheduled to be eliminated entirely by 2030
- Real GDP growth of 3.5% in 2024 substantially exceeded national average, with 68,100 net jobs added
Research Triangle Park hosts 4,000+ technology firms and 600 life sciences companies between Raleigh, Durham, and Chapel Hill. Charlotte ranks as the nation’s second-largest banking center after New York City, home to Bank of America and Truist Financial. North Carolina’s pharmaceutical exports reached $12.7 billion in 2024—second only to Indiana—reflecting substantial biologics and drug manufacturing capacity. The state’s corporate income tax rate of 2.5% is the nation’s lowest, scheduled to be fully eliminated by 2030. Real GDP grew 3.5% in 2024—substantially exceeding national averages—with 68,100 net jobs added across diverse sectors.
12. Massachusetts: Biotech and Education Hub (2.7% of U.S. GDP)
Massachusetts contributes 2.7% of U.S. GDP with approximately $785.1 billion, anchored by the nation’s most concentrated biotechnology cluster. Boston-Cambridge serves as a global capital for drug development with the state’s biopharma workforce reaching nearly 117,000 by 2024.
Massachusetts captures approximately 25% of all U.S. biotech venture capital, with 2024 funding hitting $7.8 billion—the first annual increase since the pandemic downturn. Leading companies, including Biogen, Vertex, Takeda, Moderna, Ginkgo Bioworks, and Alnylam advance cutting-edge therapies.
Roughly 15-16% of all U.S. drug pipeline candidates are based in Massachusetts, reflecting an outsized influence in pharmaceutical innovation. Recent headwinds emerged: Massachusetts experienced its first-ever net loss of R&D jobs (-1.7%) in 2024, with 4,940 workers laid off. Yet projections show 16,633 net new jobs by 2029 with 11.6% growth expected.
Population and Economic Profile: Massachusetts’s population stands at approximately 7.1 million, making it the nation’s 16th most populous state with modest growth. The state’s GDP per capita reached $96,854 in real terms ($123,276 nominal), ranking 3rd nationally—among the highest in the nation. Per capita personal income of $91,876 ranks 3rd among states, well above the national average. Information technology and life sciences lead GDP contribution ($187.3 billion combined), followed by professional and business services ($158.4 billion) and real estate ($124.6 billion). Educational institutions and research hospitals create unmatched advantages for innovation and startup formation. The state’s median household income of $95,505 ranks among the nation’s highest, reflecting a strong labor market. Boston’s cost of living ranks among the highest nationally, offsetting nominal income advantages and creating affordability challenges for lower-wage workers.
- Massachusetts captures 25% of all U.S. biotech venture capital dollars—one-quarter of nation’s biotech funding concentrated here
- 15-16% of all U.S. drug pipeline candidates are based in Massachusetts—far exceeding state’s population share
- Biopharma workforce reached 117,000 by 2024, though R&D jobs declined 1.7% in 2024 (first-ever net loss)
- $7.8 billion in 2024 biotech VC funding represented first annual increase since pandemic, suggesting sector stabilization
- Elite universities (Harvard, MIT) and research hospitals (Mass General, Brigham and Women’s) create unmatched concentration of scientific expertise
Massachusetts captures approximately 25% of all U.S. biotech venture capital dollars, with $7.8 billion in 2024 funding. Biogen, Vertex Pharmaceuticals, Takeda, Moderna, Ginkgo Bioworks, and Alnylam are among major companies headquartered in Greater Boston. Roughly 15-16% of all U.S. drug pipeline candidates are based in Massachusetts as of 2025—far exceeding the state’s population share. Harvard and MIT anchor world-class research infrastructure supporting biotech innovation and venture capital access. Massachusetts experienced its first-ever net loss of R&D jobs (-1.7%) in 2024, though projections show 16,633 new jobs by 2029.
13. Virginia: Federal Government Dependent (2.7% of U.S. GDP)
Virginia accounts for 2.7% of U.S. GDP with approximately $769.7 billion, reflecting 3.1% growth over 2023. Federal government spending accounts for 8.8% of state GDP compared to 3.6% nationally, ranking Virginia 4th in federal spending dependence. Virginia received $189 billion in federal funds during federal fiscal 2024—$22,314 per capita.
Department of Defense spending ranked second nationally at $68.5 billion, with Virginia receiving more DoD contracts than most states. Professional and business services contributed $141.1 billion to the 2024 GDP—the largest sectoral contributor—followed by government at $99.1 billion.
Federal agencies award approximately $46.2 billion annually in contracts for Virginia work, supporting high-skill, high-wage jobs. Major defense contractors include Northrop Grumman, General Dynamics, Booz Allen Hamilton, and Leidos. However, 2025 federal spending reductions present an existential risk.
Population and Economic Profile: Virginia’s population reached approximately 8.9 million in 2024, making it the nation’s 12th most populous state with steady growth. The state’s GDP per capita stands at $84,378 in real terms ($105,892 nominal), ranking 6th nationally—among the nation’s highest. Per capita personal income of $81,233 ranks 8th among states, well above the national average. Professional and business services lead GDP contribution ($141.1 billion), followed by government ($99.1 billion) and real estate ($93.8 billion). Federal government contracts and spending account for 8.8% of state GDP—far above the national average of 3.6%—creating extraordinary economic dependence on federal policy. The state’s median household income of $94,167 ranks among the nation’s highest, reflecting high-wage federal contractor positions. Northern Virginia, around Washington D.C., dominates economic activity, with downstate regions developing distinct economies less dependent on federal spending.
- Federal spending accounts for 8.8% of Virginia GDP versus 3.6% nationally—ranking Virginia 4th in federal dependence
- Virginia received $189 billion in federal funds during FY2024 ($22,314 per capita)—among highest in nation per capita
- Department of Defense awarded Virginia $68.5 billion in spending (FY2024)—second highest in nation
- Federal agencies award $46.2 billion annually in Virginia contracts, sustaining massive contractor ecosystem
- Projections suggest potential loss of 28,000+ jobs from 2025 federal spending reductions—far exceeding previous sequestration impacts
Federal spending accounts for 8.8% of Virginia’s GDP compared to 3.6% nationally, ranking the state 4th in federal dependence. Virginia received $189 billion in federal funds during federal fiscal 2024—amounting to $22,314 per capita. Department of Defense awarded Virginia $68.5 billion in spending during FY2024—the second-highest state total. Federal agencies award approximately $46.2 billion annually in Virginia contracts, sustaining the state’s contractor ecosystem. Moody’s Analytics identified Virginia as among the states facing greatest risk from 2025 federal spending reductions, projecting 28,000+ potential job losses.
14. Michigan: Automotive at Inflection Point (2.4% of U.S. GDP)
Michigan contributes 2.4% of U.S. GDP with approximately $711.5 billion, with automotive accounting for roughly 20% of state jobs and $83 billion payroll. Manufacturing contributed $101.67 billion (16.4% of GDP) in 2024, employing 570,138 people—third-highest after retail and healthcare.
Michigan’s $348 billion automotive sector faces critical inflection as electrification, automation, and global competition force fundamental restructuring. September 2024 data showed Michigan representing 20.2% of total U.S. motor vehicle production—highest share since July 2023. However, the Detroit Three’s (GM, Ford, Stellantis) U.S. market share fell from 36.1% (2023) to 34.2% (2024), continuing decades of decline.
Ford took a $19 billion write-down shifting EV capacity back to gas-powered vehicles, reflecting market uncertainty. Southern states build a “battery belt” recruiting automakers and suppliers away from Michigan. Michigan faces critical need for workforce development and sustained economic development incentives.
Population and Economic Profile: Michigan’s population stands at approximately 10.0 million, making it the nation’s 10th most populous state with slow growth. The state’s GDP per capita reached $67,341 in real terms ($78,915 nominal), ranking 24th nationally—below the national average. Per capita personal income of $64,842 ranks 31st among states. Manufacturing leads GDP contribution at $101.67 billion (16.4%), followed by professional and business services ($113.8 billion) and real estate ($95.4 billion). Transportation equipment manufacturing concentrates on automotive production—the sector’s volatility directly impacts statewide economic health. The state’s median household income of $72,158 sits below the national average, with modest wealth inequality. The automotive sector’s ongoing transformation toward electric vehicles creates both opportunity for workforce development and risk of job displacement if production moves to other states.
- Automotive sector accounts for 20% of Michigan jobs with $83 billion annual payroll—making industry’s health absolutely critical
- Detroit Three market share fell from 36.1% (2023) to 34.2% (2024), continuing two-decade erosion
- Southern states building “battery belt” are recruiting automakers and suppliers, threatening Michigan’s historical dominance
- Ford wrote down $19 billion to shift EV capacity back to gas vehicles—reflecting widespread EV market uncertainty
- Michigan represents 20.2% of U.S. motor vehicle production (Sept 2024)—highest share since July 2023
The automotive sector accounts for roughly 20% of Michigan jobs with $83 billion annual payroll—making industry health absolutely critical to state prosperity. Manufacturing contributed $101.67 billion (16.4% of GDP) in 2024, employing 570,138 people—third-highest employment after retail and healthcare. Detroit Three (GM, Ford, Stellantis) market share fell from 36.1% (2023) to 34.2% (2024), continuing decades of decline. Southern states building a “battery belt” are actively recruiting automakers and suppliers away from Michigan. Ford took a $19 billion write-down to shift EV capacity back to gas-powered vehicles, reflecting market uncertainty about the pace.
15. Colorado: Tech and Aerospace Innovation (1.9% of U.S. GDP)
Colorado contributes 1.9% of U.S. GDP with approximately $557.3 billion, driven by a remarkably concentrated technology sector (10% of employment, 20% of GDP) and significant aerospace. Tech’s concentration ranks 3rd nationally behind only Massachusetts and New Mexico.
The technology sector generated over $106 billion in GDP in 2023, paid nearly $45 billion in wages (18% of all state wages), and contributed $6.5 billion in tax revenue (20.7% of state’s total). Over the last five years, tech added 47,440 net new jobs—more than any other industry—with each tech job creating 2.67 additional jobs elsewhere (among highest multipliers nationally).
Colorado faces significant headwinds. After years topping GDP growth rankings, the state grew just 1.9% in 2024 (39th nationally), though Q4 rebounded to 3.4%. Rising costs, regulatory burden, and record tariff rates (jumping from 3% to 21% in 2025) contribute to the slowdown.
Population and Economic Profile: Colorado’s population reached approximately 6.0 million in 2024, making it the nation’s 19th most populous state with robust growth averaging 2.0% annually. The state’s GDP per capita stands at $89,894 in real terms ($114,211 nominal), ranking 9th nationally—well above the national average. Per capita personal income of $78,954 ranks 14th among states. Information technology leads GDP contribution at $167.4 billion (20% of economy), followed by professional and business services ($128.3 billion) and real estate ($103.8 billion). The tech sector’s rapid expansion has driven population growth and talent attraction, though rising housing costs and regulatory pressures create affordability challenges. The state’s median household income of $94,452 ranks among the nation’s highest, reflecting strong labor market. Recent economic cooling suggests potential structural challenges despite tech sector advantages.
- Tech sector generates 20% of Colorado GDP (3rd-highest nationally)—exceeding agriculture, energy, and aerospace combined
- Tech sector added 47,440 net new jobs over five years, with each job creating 2.67 additional jobs elsewhere (highest multipliers nationally)
- AI jobs increased 62% in Colorado—13 percentage points above U.S. average—reflecting emerging tech concentration
- Colorado recognized as “quantum tech hub” with unique advantages including Nobel Prize winners and specialized research programs
- After topping GDP growth rankings for years, Colorado grew just 1.9% in 2024 (39th nationally) before Q4 rebound to 3.4%
Tech sector represents 20% of Colorado’s economy, the 3rd-highest concentration nationally—generating over $106 billion in GDP and $45 billion in wages. Over the last five years, tech added 47,440 net new jobs with each position creating 2.67 additional jobs elsewhere in the economy. Colorado is recognized as a “quantum tech hub” with unique advantages in quantum computing, including Nobel Prize winners and specialized research programs. AI jobs increased 62% over the last year—13 percentage points above the national growth rate. Colorado’s GDP growth slowed to 1.9% in 2024 (39th nationally) after years leading the nation, with tariff and cost pressures cited as primary headwinds.
16. Arizona: Semiconductor Manufacturing Hub (1.9% of U.S. GDP)
Arizona accounts for 1.9% of U.S. GDP with approximately $555.6 billion, undergoing dramatic transformation through $210+ billion in semiconductor manufacturing investments. The state positions itself as “America’s semiconductor headquarters” through unprecedented chip fabrication concentration since 2020.
Arizona secured 60+ semiconductor facility expansions representing over $210 billion in capital investment and creating 15,700+ direct jobs with tens of thousands of construction and supplier positions. TSMC’s Phoenix campus represents the cornerstone—the company’s $165 billion planned investment is the largest foreign direct investment package in U.S. history.
TSMC received $6.6 billion in CHIPS Act subsidies, planning three Phoenix fabrication facilities producing cutting-edge 2-nanometer chips and employing 6,000+ high-skill workers. Arizona’s manufacturing GDP climbed from $28.5 billion (2018) to $39.2 billion (2024)—37.7% increase versus 7.7% national rate. Manufacturing employment grew 10% from 2019-2024—ten times the national average.
Population and Economic Profile: Arizona’s population reached approximately 7.4 million in 2024, making it the nation’s 14th most populous state with 15.0% growth since 2010. The state’s GDP per capita stands at $72,938 in real terms ($92,849 nominal), ranking 19th nationally—slightly above the national average. Per capita personal income of $69,441 ranks 24th among states. Real estate dominates GDP contribution ($174.3 billion), followed by professional and business services ($148.7 billion) and manufacturing ($39.2 billion—rapidly expanding). The semiconductor boom is transforming Arizona from service-based toward advanced manufacturing economy. Phoenix metropolitan area dominance creates geographic inequality, with rural regions developing distinct economies. The state’s median household income of $82,157 exceeds the national average, reflecting demographic composition of retirees and knowledge workers.
- TSMC’s $165 billion planned Arizona investment is the largest foreign direct investment package in U.S. history
- Since 2020, Arizona secured $210+ billion in semiconductor investments—largest concentration in U.S. history
- Manufacturing GDP jumped 37.7% (2018-2024)—nearly five times national growth rate of 7.7%
- Manufacturing employment grew 10% (2019-2024)—ten times the national average
- 60+ semiconductor facility expansions since 2020 created 15,700+ direct jobs with tens of thousands of secondary employment
TSMC’s $165 billion planned Arizona investment represents the largest foreign direct investment package in U.S. history. Since 2020, Arizona secured 60+ semiconductor facility expansions representing over $210 billion in capital investment. Manufacturing GDP climbed from $28.5 billion (2018) to $39.2 billion (2024)—a 37.7% increase representing nearly five times the 7.7% national growth rate. Manufacturing employment grew 10% from 2019-2024—more than ten times the national average. TSMC received $6.6 billion in CHIPS Act subsidies for three Phoenix fabrication facilities producing cutting-edge 2-nanometer chips.
17. Tennessee: Advanced Manufacturing Leader (1.9% of U.S. GDP)
Tennessee contributes 1.9% of U.S. GDP with $443.8 billion gross state product in 2025 (3.8% increase), projected to grow 2.5% in 2025—faster than national average. Manufacturing generates over $70 billion in value-added output (14.8% of GDP) and employs 362,480 residents (12.7% of private sector jobs).
Automotive manufacturing constitutes 16.6% of manufacturing output and 18.4% of workforce, with Tennessee ranking 3rd nationally in auto manufacturing jobs. Employment reached 66,828 in 2024 with projections to reach 86,459 workers by 2032 (2.6% average annual growth).
Tennessee’s EV positioning appears particularly strong, with $16.6 billion in announced investments and expected 18,300 new jobs. Ford’s EV battery complex in West Tennessee and GM’s $4 billion Spring Hill investment announced June 2025 accelerate transition. Nashville added 24,000 jobs in 2023, ranking second-highest among U.S. cities for post-pandemic GDP growth.
Population and Economic Profile: Tennessee’s population reached approximately 7.2 million in 2024, making it the nation’s 15th most populous state with robust 2.8% annual growth. The state’s GDP per capita stands at $61,651 in real terms ($78,448 nominal), ranking 26th nationally below the national average. Per capita personal income of $61,287 ranks 40th among states, reflecting a manufacturing-centered economy. Manufacturing leads GDP contribution at $70 billion (14.8%), followed by professional and business services ($125.4 billion) and real estate ($96.7 billion). The automotive sector’s transformation toward electric vehicles creates significant opportunity for workforce development and supply chain expansion. Nashville’s economy and tech sector growth provide economic diversification beyond automotive manufacturing. The state’s median household income of $73,157 is below the national average, though it is growing rapidly.
- Tennessee attracted $16.6 billion in EV investments expected to create 18,300 new jobs—third-highest in nation
- Automotive employment projected to reach 86,459 by 2032—2.6% average annual growth from current 66,828
- Ford’s EV battery complex and GM’s $4 billion Spring Hill investment exemplify major OEM bets on Tennessee
- Nashville added 24,000 jobs in 2023, showing second-highest city GDP growth nationally post-pandemic
- Unemployment maintained record low 3.4% through 2024 despite rapid industrial transformation
Tennessee attracted $16.6 billion in announced EV investments expected to create 18,300 new jobs, positioning it as national EV leader. Automotive manufacturing accounts for 16.6% of manufacturing output with Tennessee ranking 3rd nationally in auto manufacturing jobs. Auto employment reached 66,828 in 2024 with projections to reach 86,459 by 2032—2.6% average annual growth. Ford’s EV battery manufacturing complex in West Tennessee and GM’s $4 billion Spring Hill facility investment announced June 2025 demonstrate major OEM commitment. Nashville added 24,000 jobs in 2023, demonstrating metro economy strength with the second-highest city GDP growth nationally post-pandemic.
18. Maryland: Federal Contracting and Biotech (1.9% of U.S. GDP)
Maryland accounts for 1.9% of U.S. GDP with approximately $546.4 billion in 2024, reflecting 2.2% growth over 2023. Federal spending dominates extraordinarily—Maryland received $46 billion in procurement contracts, $30.6 billion in grants, and $37.7 billion in direct payments in FY2024, ranking 4th nationally.
Department of Defense contracting increased from $13.6 billion (FY2017) to $18.4 billion (FY2024)—a $4.6 billion increase, with FY2024 representing the highest DoD total since FY2020. Industries cluster around government funding, creating vulnerability to federal policy shifts.
The National Institutes of Health (NIH) anchors Maryland’s biomedical ecosystem. In FY2024, HHS allocated $30 billion in Maryland, including $5.2 billion in wages, $14.8 billion in grants, $8.7 billion in contracts, and $1.6 billion in direct payments. Nearly 50% of HHS contracts flow through NIH for biomedical research and IT services.
Population and Economic Profile: Maryland’s population stands at approximately 6.2 million, making it the nation’s 17th most populous state with modest growth. The state’s GDP per capita reached $83,461 in real terms ($106,792 nominal), ranking 7th nationally—among the nation’s highest. Per capita personal income of $79,845 ranks 11th among states. Government leads GDP contribution at $87.7 billion, followed by professional and business services ($75.0 billion) and real estate ($73.9 billion). Federal government spending accounts for extraordinary 16% of state GDP—far above the national average—making the state extremely vulnerable to federal budget fluctuations. The state’s median household income of $95,218 ranks among the nation’s highest, reflecting high-wage federal and contractor positions. Northern Maryland around Washington D.C. dominates economic activity, with Baltimore region and southern counties developing distinct economic bases.
- Maryland received $46 billion in federal procurement contracts (FY2024)—ranking 4th nationally and creating extreme federal dependence
- Department of Defense awarded $18.4 billion in contracts (FY2024)—the highest total since FY2020 and second-highest in nation
- National Institutes of Health allocated $30 billion in Maryland (FY2024)—nearly 50% of HHS contracts flowing through NIH
- Professional and business services contribute $75.0 billion (2024 GDP)—second-largest after government at $87.7 billion
- Moody’s identified Maryland as facing greatest risk from 2025 federal cuts—projecting 28,000+ job losses
Maryland received $46 billion in federal procurement contracts in FY2024, ranking 4th nationally and creating an extraordinary level of federal dependence. Department of Defense awarded Maryland $18.4 billion in contracts (FY2024)—the highest total since FY2020. The National Institutes of Health allocated $30 billion in Maryland during FY2024, with nearly 50% of HHS contracts flowing through NIH. Professional and business services contributed $75.0 billion to the 2024 GDP, the second-largest sector after government at $87.7 billion. Moody’s Analytics identified Maryland as facing the greatest risk from 2025 federal spending reductions, projecting 28,000+ potential job losses.
19. Indiana: Pharmaceutical Manufacturing Leader (1.8% of U.S. GDP)
Indiana contributes 1.8% of U.S. GDP with $530.7 billion in 2024, anchored by the nation’s largest pharmaceutical manufacturing cluster and diverse traditional manufacturing. Pharmaceutical production constitutes 57.2% of Indiana’s nondurable goods manufacturing compared to 40.9% nationwide—an extraordinary concentration.
Indiana’s pharmaceutical manufacturing sector leads nationally, with major facilities including Eli Lilly in Indianapolis, Catalent and Baxter in Bloomington, PharmaCord in Jeffersonville, IntegriMedical in Bainbridge, and Eradivir in West Lafayette, driving substantial economic output.
This pharmaceutical concentration drives comparative economic strength. Indiana’s nondurable sector grew 11.9% from Q2 2024 to Q2 2025—dramatically outperforming neighboring states where the sector contracted (Illinois -1.6%, Michigan -1.5%, Ohio -0.9%).
Automotive manufacturing is another pillar, with Indiana ranking as America’s 2nd-largest auto-manufacturing state after Michigan. The industry accounts for 217,300 total auto jobs (5.2% of state employment), generates $30.68 billion in GSP (6.2% of GDP), and delivers $15.44 billion in labor income annually.
Population and Economic Profile: Indiana’s population stands at approximately 6.8 million, making it the nation’s 18th most populous state, with slow growth. The state’s GDP per capita reached $75,873 in real terms ($95,643 nominal), ranking 16th nationally—slightly above the national average. Per capita personal income of $70,432 ranks 25th among states. Manufacturing leads GDP contribution at $141.3 billion (27.8%), followed by professional and business services ($104.7 billion) and real estate ($88.5 billion). This extraordinary manufacturing concentration far exceeds the national average (8.4%), with the pharmaceutical and automotive sectors driving economic activity. The state’s median household income of $75,238 sits below the national average, reflecting a manufacturing-centered economy with moderate wages. Geographic concentration in Indianapolis and manufacturing regions creates economic inequality between urban centers and rural areas.
- Indiana leads the nation in pharmaceutical manufacturing concentration, with the sector comprising 57.2% of nondurable goods versus 40.9% nationally.
- Pharmaceutical production constitutes 57.2% of Indiana’s nondurable goods manufacturing versus 40.9% nationally, extraordinary concentration
- Indiana’s nondurable sector grew 11.9% (Q2 2024-Q2 2025) while neighboring states contracted (IL -1.6%, MI -1.5%, OH -0.9%)
- Automotive industry accounts for 217,300 jobs (5.2% of employment) and $30.68 billion in GSP (6.2% of GDP)
- Eli Lilly, Catalent, and Baxter anchor pharmaceutical ecosystem making Indiana global pharma manufacturing powerhouse
Indiana leads the nation in pharmaceutical manufacturing concentration, with the sector comprising 57.2% of nondurable goods manufacturing compared to only 40.9% nationwide—extraordinary concentration. Indiana’s nondurable sector grew 11.9% from Q2 2024 to Q2 2025, while neighboring states’ sectors contracted (Illinois -1.6%, Michigan -1.5%, Ohio -0.9%). Automotive manufacturing ranks as the 2nd-largest in the state, with 217,300 total auto jobs (5.2% of employment) generating $30.68 billion in gross state product. Eli Lilly, Catalent, and Baxter anchor Indiana’s pharmaceutical ecosystem, making it a global powerhouse in drug manufacturing. Major pharmaceutical facilities span the state including Indianapolis, Bloomington, Jeffersonville, Bainbridge, and West Lafayette.
20. Minnesota: Fortune 500 Concentration (1.7% of U.S. GDP)
Minnesota rounds out the top 20 with 1.7% of U.S. GDP and approximately $502.9 billion gross state product, distinguished by extraordinary Fortune 500 concentration. Minnesota headquartered 17 Fortune 500 companies in 2025, giving Twin Cities the highest per-capita concentration despite ranking just 10th nationally in absolute count.
Corporate giants include UnitedHealth Group (3rd nationally), Target (41st), U.S. Bancorp (105th), General Mills (188th), 3M (215th), CHS (277th), Best Buy (310th), and others spanning healthcare, retail, financial services, food, and industrial products. Fortune 500 firms account for approximately 600,000 jobs worldwide.
Recent economic performance suggests challenges. Minnesota’s per capita GDP growth dropped to 1% annually over the last decade versus 1.8% nationally, with GDP ranking falling from 18th (2007-2019) to 33rd (2019-2024). In 2023, real GDP grew merely 1.2%, ranking 45th nationally.
Healthcare anchors Minnesota’s largest industry, with Mayo Clinic in Rochester (one of world’s most renowned) and UnitedHealth Group (nation’s 2nd-largest health insurer). Advanced manufacturing, agriculture, retail, financial services, and clean energy round out major sectors.
Population and Economic Profile: Minnesota’s population is approximately 5.7 million, making it the nation’s 21st-most populous state, with slow population growth. The state’s GDP per capita reached $86,874 in real terms ($110,348 nominal), ranking 10th nationally—above the national average. Per capita personal income of $79,127 ranks 12th among states. Healthcare services lead GDP contribution at $142.8 billion, followed by professional and business services ($118.6 billion) and real estate ($107.3 billion). Fortune 500 concentration provides economic stability but limits diversification benefit, with corporate challenges directly impacting statewide prosperity. The state’s median household income of $93,687 ranks among the nation’s highest, reflecting a strong labor market and high concentration of knowledge workers. Twin Cities metropolitan area dominance creates geographic inequality, with greater Minnesota regions developing distinct economies focused on agriculture, manufacturing, and natural resources.
- Minnesota headquartered 17 Fortune 500 companies—highest per-capita concentration nationally despite ranking 10th in absolute count
- Minnesota’s per capita GDP growth dropped to 1% annually (last decade) versus 1.8% nationally—trailing competitor states
- GDP ranking fell from 18th (2007-2019) to 33rd (2019-2024)—dramatic relative decline despite large Fortune 500 roster
- Real GDP grew just 1.2% in 2023, ranking 45th nationally—well below 2.5%+ national average
- UnitedHealth Group ranks 3rd nationally in Fortune 500 list—among Minnesota’s most important companies
17 Minnesota-based Fortune 500 companies in 2025, giving the Twin Cities the highest per-capita concentration nationally. UnitedHealth Group (3rd nationally), Target (41st), U.S. Bancorp (105th), and General Mills (188th) anchor Minnesota’s corporate roster. Minnesota’s per capita GDP growth over the last decade dropped to 1% annually, compared with 1.8% nationally, trailing competitor states. GDP ranking fell from 18th (2007-2019) to 33rd (2019-2024), reflecting relative economic decline despite the concentration of Fortune 500 companies. Healthcare is Minnesota’s largest industry, anchored by the Mayo Clinic (one of the world’s most renowned) and UnitedHealth Group (the 2nd-largest health insurer nationally).
The Geographic Divide
The top 20 states generate more than 80% of U.S. GDP while representing less than 50% of the land area and approximately 70% of the population. This concentration reflects industry clustering, talent magnetism, infrastructure, and policy choices that advantage certain regions.
California’s technology dominance, Texas’s energy and export prowess, New York’s financial centrality, and Florida’s population-driven growth exemplify different pathways to economic leadership. Pharmaceutical concentration in New Jersey and Indiana, aerospace in Washington, research triangles in North Carolina, automotive in Michigan, federal contracting in Virginia and Maryland, and Fortune 500 concentration in Minnesota demonstrate diverse economic models.
These rankings are always changing. States move up or down depending on industry trends, policy choices, population shifts, and new technology. For example, Colorado’s recent slowdown, Arizona’s focus on semiconductors, and Michigan’s changes in the auto industry show how quickly things can shift. The real question is which states will invest wisely to move up, and which might fall behind.
This Table shows every state’s share of U.S. GDP (October 2025):
| Rank | State | Share of U.S. GDP | ||
|---|---|---|---|---|
| 1 | California | 14.5% | ||
| 2 | Texas | 9.4% | ||
| 3 | New York | 7.9% | ||
| 4 | Florida | 5.8% | ||
| 5 | Illinois | 3.9% | ||
| 6 | Pennsylvania | 3.5% | ||
| 7 | Ohio | 3.1% | ||
| 8 | Georgia | 3.0% | ||
| 9 | Washington | 3.0% | ||
| 10 | New Jersey | 2.9% | ||
| 11 | North Carolina | 2.9% | ||
| 12 | Massachusetts | 2.7% | ||
| 13 | Virginia | 2.7% | ||
| 14 | Michigan | 2.4% | ||
| 15 | Colorado | 1.9% | ||
| 16 | Arizona | 1.9% | ||
| 17 | Tennessee | 1.9% | ||
| 18 | Maryland | 1.9% | ||
| 19 | Indiana | 1.8% | ||
| 20 | Minnesota | 1.7% | ||
| 21 | Missouri | 1.5% | ||
| 22 | Wisconsin | 1.5% | ||
| 23 | Connecticut | 1.3% | ||
| 24 | South Carolina | 1.2% | ||
| 25 | Oregon | 1.1% | ||
| 26 | Louisiana | 1.1% | ||
| 27 | Alabama | 1.1% | ||
| 28 | Utah | 1.0% | ||
| 29 | Kentucky | 1.0% | ||
| 30 | Oklahoma | 0.9% | ||
| 31 | Iowa | 0.9% | ||
| 32 | Nevada | 0.9% | ||
| 33 | Kansas | 0.8% | ||
| 34 | Arkansas | 0.7% | ||
| 35 | District of Columbia | 0.6% | ||
| 36 | Nebraska | 0.6% | ||
| 37 | Mississippi | 0.5% | ||
| 38 | New Mexico | 0.5% | ||
| 39 | Idaho | 0.4% | ||
| 40 | New Hampshire | 0.4% | ||
| 41 | Hawaii | 0.4% | ||
| 42 | West Virginia | 0.4% | ||
| 43 | Delaware | 0.3% | ||
| 44 | Maine | 0.3% | ||
| 45 | Rhode Island | 0.3% | ||
| 46 | North Dakota | 0.3% | ||
| 47 | Montana | 0.3% | ||
| 48 | South Dakota | 0.3% | ||
| 49 | Alaska | 0.2% | ||
| 50 | Wyoming | 0.2% | ||
| 51 | Vermont | 0.2% |


