
Infographics
World’s Richest Cities by GDP (Nominal)
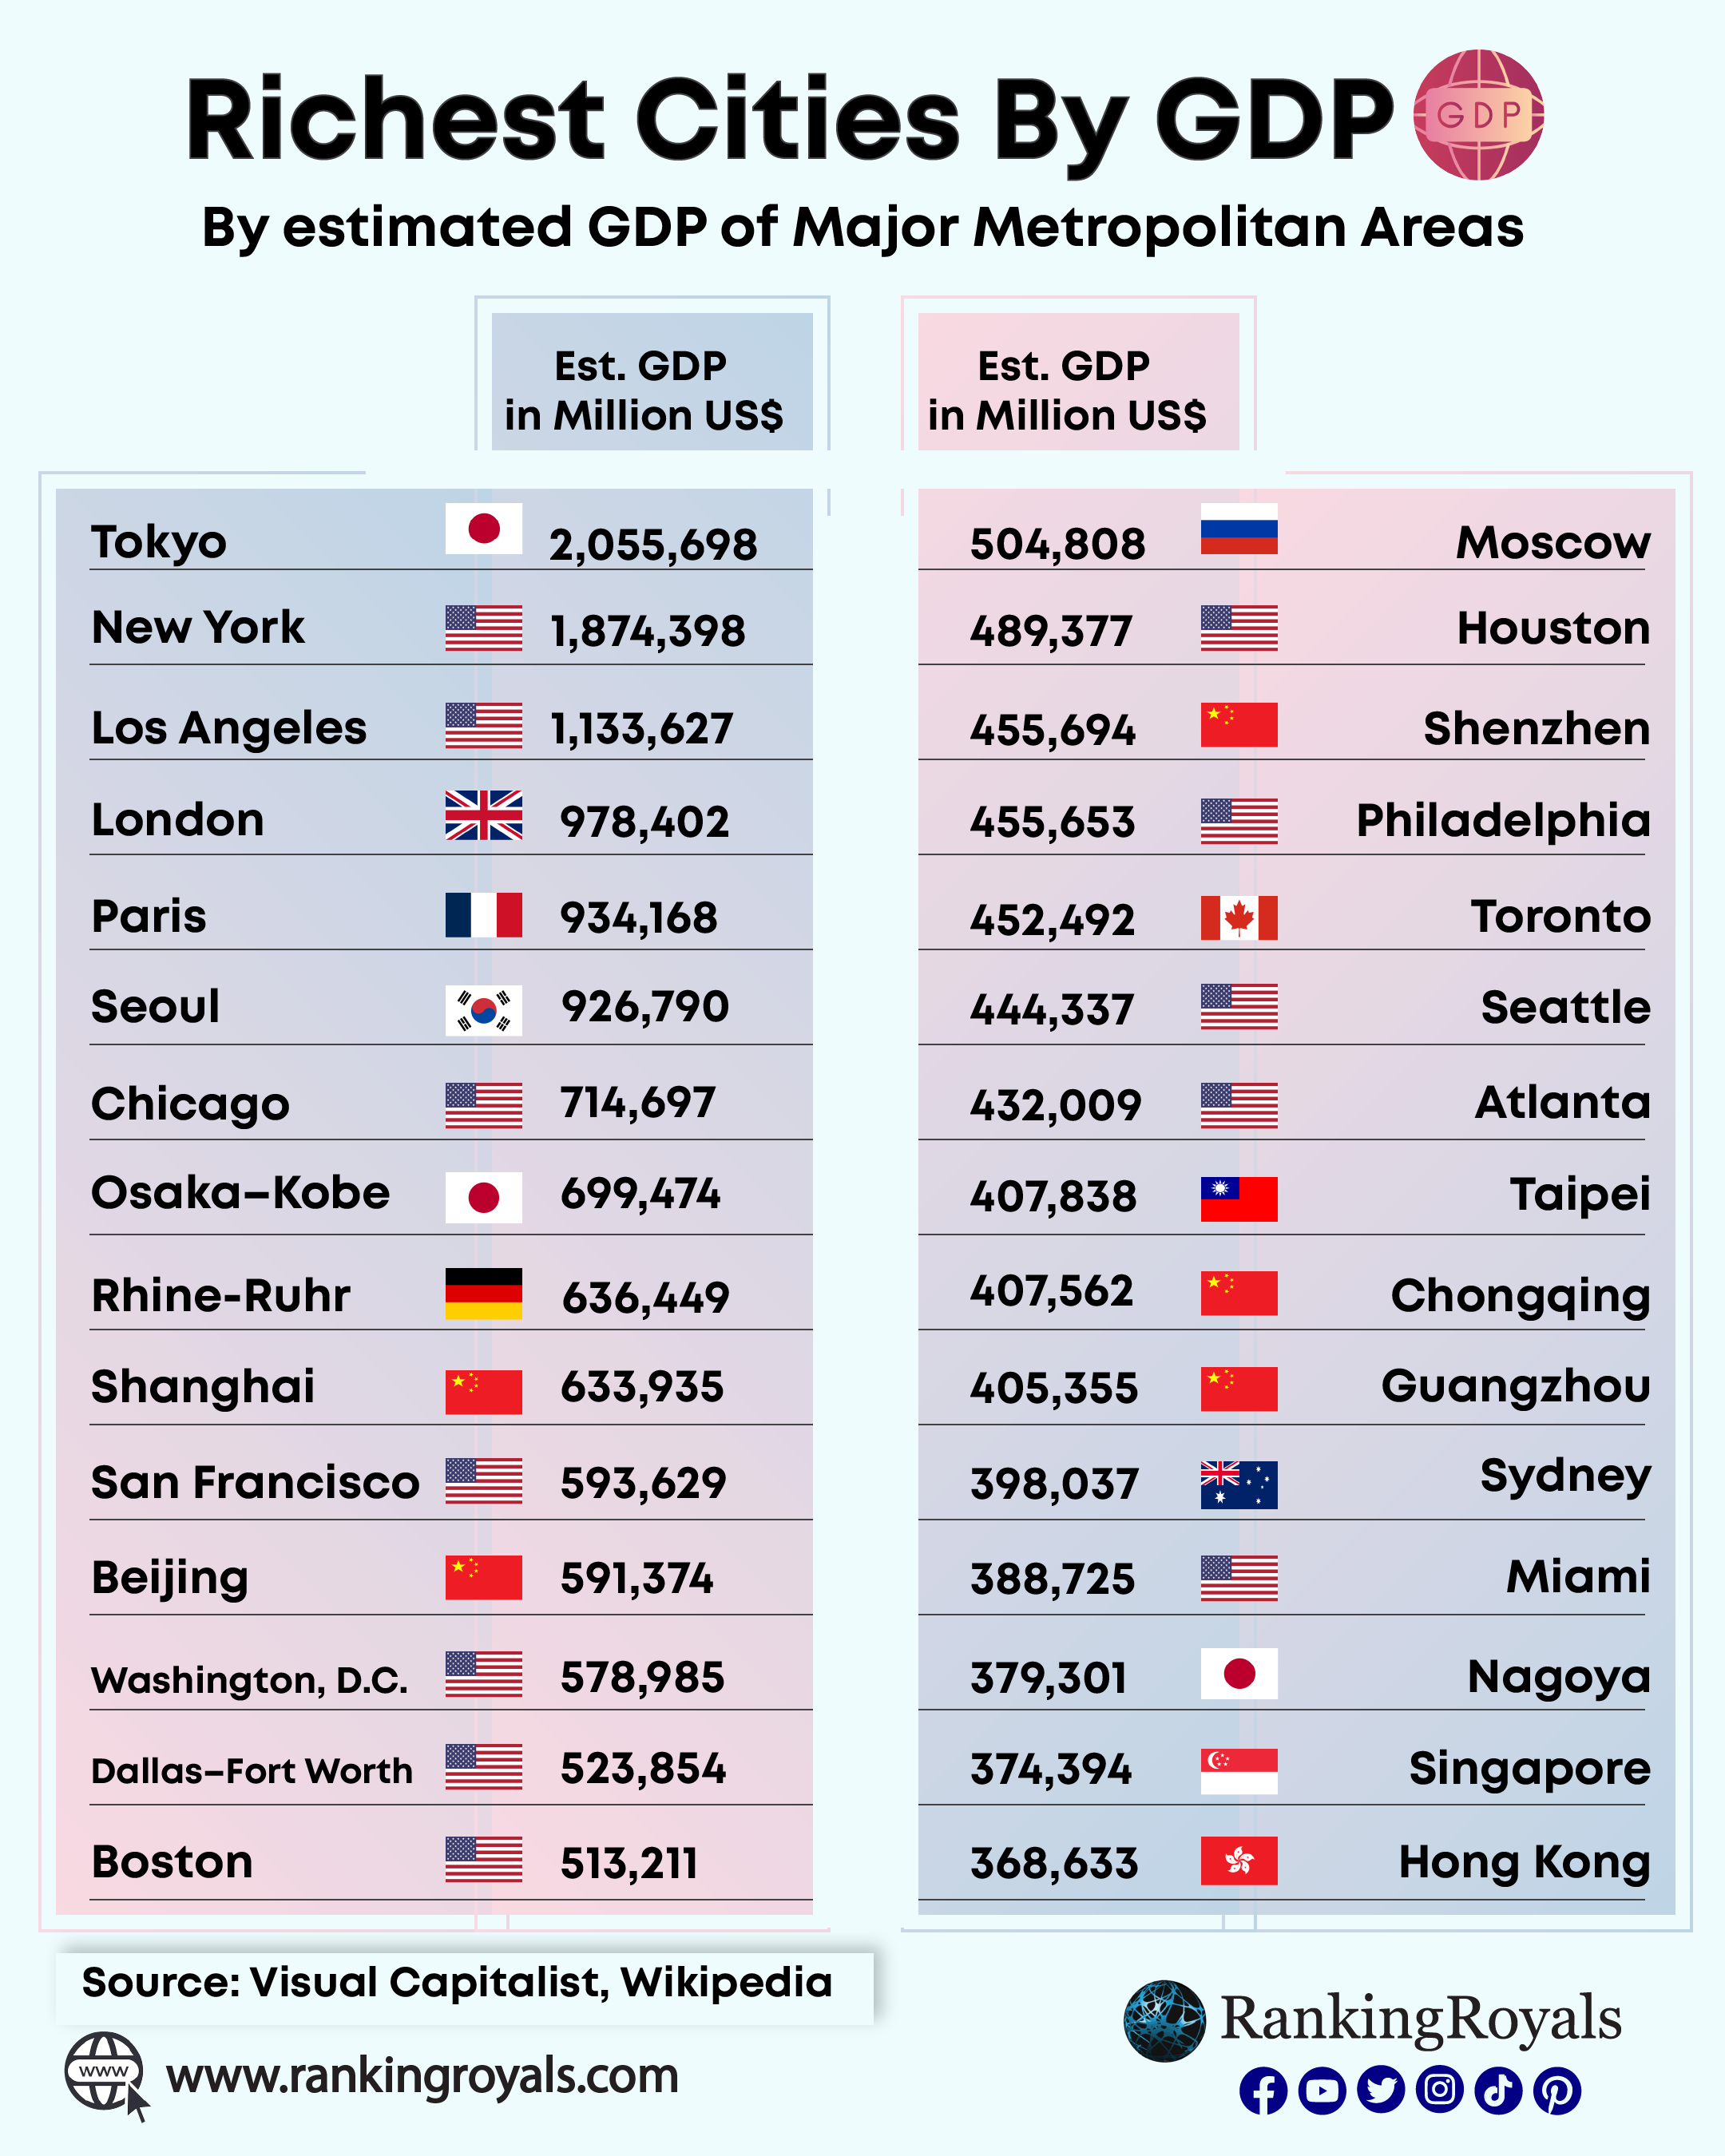
The World’s Richest City by GDP is Tokyo, followed by New York, Los Angeles, London, and Paris.
Tokyo metropolitan area is the richest metropolitan area by estimated nominal GDP of 2.05 trillion dollars.

Tokyo is a significant center for global finance, serving some of the biggest investment banks and insurance firms in the world. Tokyo also serves as the hub for Japan’s publishing, electronics, broadcasting, and transportation industries.
Here is a list of the Richest Metropolitan areas by GDP:
| Rank (nominal) | Metropolitan Area | Country | Region | Est. GDP in Million US$ |
|---|---|---|---|---|
| 1 | Tokyo | Japan | Eastern Asia | 2,055,698 |
| 2 | New York | United States | Northern America | 1,874,398 |
| 3 | Los Angeles | United States | Northern America | 1,133,627 |
| 4 | London | United Kingdom | Northern Europe | 978,402 |
| 5 | Paris | France | Europe | 934,168 |
| 6 | Seoul | South Korea | Eastern Asia | 926,790 |
| 7 | Chicago | United States | Northern America | 714,697 |
| 8 | Osaka–Kobe | Japan | Eastern Asia | 699,474 |
| 9 | Rhine-Ruhr | Germany | Europe | 636,449 |
| 10 | Shanghai | China | Eastern Asia | 633,935 |
| 11 | San Francisco | United States | Northern America | 593,629 |
| 12 | Beijing | China | Eastern Asia | 591,374 |
| 13 | Washington, D.C. | United States | Northern America | 578,985 |
| 14 | Dallas–Fort Worth | United States | Northern America | 523,854 |
| 15 | Boston | United States | Northern America | 513,211 |
| 16 | Moscow | Russia | Eastern Europe | 504,808 |
| 17 | Houston | United States | Northern America | 489,377 |
| 18 | Shenzhen | China | Eastern Asia | 455,694 |
| 19 | Philadelphia | United States | Northern America | 455,653 |
| 20 | Toronto | Canada | Northern America | 452,492 |
| 21 | Seattle | United States | Northern America | 444,337 |
| 22 | Atlanta | United States | Northern America | 432,009 |
| 23 | Taipei | Taiwan(ROC) | Eastern Asia | 407,838 |
| 24 | Chongqing | China | Eastern Asia | 407,562 |
| 25 | Guangzhou | China | Eastern Asia | 405,355 |
| 26 | Sydney | Australia | Australia and New Zealand | 398,037 |
| 27 | Miami | United States | Northern America | 388,725 |
| 28 | Nagoya | Japan | Eastern Asia | 379,301 |
| 29 | Singapore | Singapore | South-eastern Asia | 374,394 |
| 30 | Hong Kong | Hong Kong (SAR) | Eastern Asia | 368,633 |
| 32 | Milan | Italy | Europe | 329,529 |
| 33 | Melbourne | Australia | Australia and New Zealand | 318,677 |
| 33 | San Diego | United States | Northern America | 290,330 |
| 34 | Jakarta | Indonesia | South-eastern Asia | 308,250 |
| 35 | Suzhou | China | Eastern Asia | 301,510 |
| 37 | Madrid | Spain | Europe | 280,937 |
| 38 | Phoenix | United States | Northern America | 341,841 |
| 39 | Mumbai | India | Southern Asia | 277,980 |
| 40 | Delhi | India | Southern Asia | 272,603 |
| 41 | Minneapolis-St. Paul | United States | Northern America | 342,373 |
| 42 | Detroit | United States | Northern America | 357,731 |
| 43 | São Paulo | Brazil | South America | 261,642 |
| 44 | Chengdu | China | Eastern Asia | 260,409 |
| 45 | Busan–Gyeongnam Area | South Korea | Eastern Asia | 252,145 |
| 46 | Bangkok | Thailand | South-eastern Asia | 252,128 |
| 47 | Mexico City | Mexico | Northern America | 250,455 |
| 48 | Munich | Germany | Europe | 249,764 |
| 49 | Hangzhou | China | Eastern Asia | 248,721 |
| 50 | Istanbul | Turkey | Western Asia | 247,312 |
| 51 | Berlin | Germany | Europe | 243,160 |
| 52 | Tianjin | China | Eastern Asia | 235,664 |
Share this:

Continue Reading
Pingback: Richest Metropolitan areas by nominal GDP. – 21st Century Library & Information Science Network